Geographic Data Quality Management for Pedestrian Navigation In-the-wild
1. Introduction
Pedestrian navigation in urban environments is essential not only for safely exploring unfamiliar cities but also for actively engaging with the urban landscape through interactive and context-aware technologies. In pedestrian navigation, well-curated volunteered geographic information (VGI) and dynamically maintained user-generated content (UGC) are essential for creating immersive urban journeys; VGI is the foundation of map-based navigation, and UGC provides attractive objects on the map. Let us imagine the following scenario.
In the afternoon, Emily strolls through an urban park. She interacts with an AI assistant on her smartphone that provides personalized suggestions based on her real-time location. Guided by the assistant, she discovers attractions, such as a small cafe and a sculpture garden, places she might otherwise miss, turning a routine walk into an enriching journey (i.e., experience).
The scenario shows the clues on how researchers develop their customizable navigation systems for scientific experiments. Deploying such systems is a starting point to investigate the hypotheses of researchers through user experiments. For example, discovery-driven experience beyond mere efficiency seems to be promising in enhancing everyday mobility [1]; to tackle such a hypothesis, well-organized VGI and UGC, such as maps, walkable routes, attractions, and customer reviews, are essential.
The performance of pedestrian navigation systems depends heavily on the quality of VGI and the richness of UGC. Researchers commonly use public VGI and UGC to study location-based services [2], [3], and have evaluated their quality (see also Section 2.1). However, the relationship among geospatial data quality, users' mobility experience, and real-world pedestrian navigation systems remains underexplored.
To address this gap, using publicly available data sources and standard routing engines, we investigate (1) how the quality of geographic data affects the design and evaluation of rich mobility experiences, and (2) whether or not the current data is enough for in-the-wild experiments. While our experiments are conducted in a specified park (Hibiya Park) with a high-cost but accurate positioning device (RTK-GNSS), we expect the insights to generalize to other venues (e.g., heritage sites, amusement parks) and diverse user groups (e.g., wheelchair users).
The rest of this paper is organized as follows. After summarizing related work in Section 2, we explain our navigation experiments in Section 3. In Section 4, we explain our findings. We then discuss insights observed from the experiments and highlight the necessity of developing fine-grained and well-organized open datasets to improve navigation experiences in Section 5. We conclude our experimental study in Section 6, which advocates for new research efforts to develop and refine mobility experiences via in-the-wild experiments.
2. Related Work
Maintaining fine-grained, well-organized, accurate, and personalized, if possible, geographic data has attracted much attention. We review two main components of implementing navigation in-the-wild: geographic data and routing engines. Combining these components, researchers can build a customizable navigation environment for scientific research.
2.1 Geographic Data
Preparing geographic data is mandatory when implementing navigation systems. OpenStreetMap is one of the well-adopted resources [2], [4]. Contributors upload, update, validate, and manage the public data, and therefore, researchers have addressed the quality management [5].
When building navigation systems, geographic data and its quality are essential. For the assessment, Arsanjani et al. compared OSM data with administrative data; they clustered contributors into skill hierarchy (e.g., professional and beginners) [6]. Their results indicate that OSM's contents were moderately accurate, but even skilled contributors contained some inaccurate positioning and semantic information. Biljecki et al. also evaluated the quality of buildings [7]. Kounadi mentioned an existing study using discrepancy tests between OSM and ground-truth data, stating that the total average discrepancy was approximately 6 meters [8]. Mooney et al. discussed unsupervised methods to evaluate the quality of OSM [9], and they mentioned all quality considerations are use-case sensitive in VGI where quality depends on what the (VGI) data will be used for.
Based on the above studies, our experiments also require customized geographic data. While existing works, such as [5], [9], have proposed general frameworks for evaluating the quality of VGI, they primarily focus on systemic assessments or map-level discrepancies. In contrast, our approach examines how such data imperfections directly impact real-time pedestrian navigation and user experience in actual environments. For this purpose, we conduct our pedestrian navigation experiments outside of the laboratory in Hibiya Park*1. The field and the extracted OSM graph are illustrated in Fig. 1, and the details of our field work are presented in Section 3. We then discuss the role of data quality in shaping mobility experiences in Section 4.
![Hibiya Park and its OSM graph data. The map is based on Digital Japan Basic Maps, published by the Geospatial Information Authority of Japan, whose license PDL 1.0 (Public Data License, Version 1.0), compatible with CC BY 4.0 [10]-[13].](TR0701-04/image/7-1-4-1.png)
In this paper, we focus on VGI for pedestrian-scale navigation because of the following reasons. First, coverage and update latency at the walkway/amenity level are superior, where official/commercial datasets lack small trails or temporary closures, particularly from a worldwide perspective. Second, licensing and cost allow iterative, community-driven refinement aligned with in-the-wild experiments. Furthermore, participatory correction enables rapid topology fixes (e.g., missing links, plaza polygons, curb ramps) observed in our field site, which we discuss in Section 5.3. Notably, our goal is not to replace professional datasets but to operationalize VGI quality management so that researchers can feasibly run customizable and real-world navigation studies.
2.2 Routing Engines
Developing routing engines (i.e., planning algorithms under complex constraints) is a major research topic [14]-[17]. We can implement existing algorithms or adopt existing routing APIs (e.g., Open Source Routing Machine [18]).
To integrate a routing engine into experiments, pre-processed geographic data (e.g., OSM-based) is required, and the differences of background data may affect the computed routes, as depicted in Fig. 2. As illustrated in Fig. 1, the extracted OSM road network does not perfectly match the displayed map. Therefore, a routing engine on OSM has computed walkable but longer routes (displayed in blue). Once we visit Hibiya Park, we can easily identify more efficient routes in terms of distance by following trails that are not displayed on the map. To make navigation routes more persuasive and valuable, we need to customize geographic data, as explained in Section 4.1 for details. Using such a customized graph, we can compute more favorable and suitable routes (displayed in red). However, such customized routes may not align with existing map visualizations from a cartographic viewpoint, potentially confusing users when the visual appearance of the map does not match the actual route logic.
![Two routes [OSM-based and real]. On the OSM graph, the blue route is computed by OSRM [18] as a shortest route, but it is not the real shortest route. In the park, the red route is the shortest route, but it does not align with the cartographic design: the base map lacks sufficient information.](TR0701-04/image/7-1-4-2.png)
In summary, managing high-quality geographic data together with routing engines is inevitable for in-the-wild experiments. We will discuss these aspects together with our experiences later.
3. Pilot Experiments
Our experiment in this paper was designed using publicly available VGI and UGC around Hibiya Park and tried to investigate the applicability and feasibility of pedestrian navigation research in-the-wild environment.
3.1 Backgrounds
The original motivation of our navigation in-the-wild experiments was to investigate the connection between navigation technologies and pedestrian perceptions. For this purpose, we designed a standard field user study protocol (purposes, participants, recruitment, evaluations, experiments, informed consent, and others), which was approved by our institution's ethics committee [Toyota Central R&D Labs., Inc., Ethics Committee] (approval ID: 24A-12).
Prior to hiring participants, we conducted internal pilot experiment environment setup tests to validate system configuration and core functionality under realistic conditions. This paper focuses on the technical challenges and findings of preparing geographic data and conducting in-the-wild experiments found during the pilot tests.
3.2 Focus of This Paper
Instead of reporting full-scale field experiments, to validate system configuration and core functionality under realistic conditions, this paper focused on:
- ・How researchers can prepare in-the-wild pedestrian navigation environments using publicly available VGI and UGC.
- ・How geographic data quality impacts pedestrian navigation performance in in-the-wild tests.
We then built a prototype pedestrian navigation system and evaluated its ability to guide users to pre-defined destinations under our test environment. Note that the same procedure can apply to other settings; for example, amusement parks [19], heritage sites [20], or college campuses [21].
3.3 Environment
We developed our environment as a Web browser-based pedestrian navigation application, which illustrates routes based on the prepared geographic information and navigation routes. This study does not propose a new system; by combining volunteered geographic information and standard routing engines, we built a customizable navigation environment for scientific research.
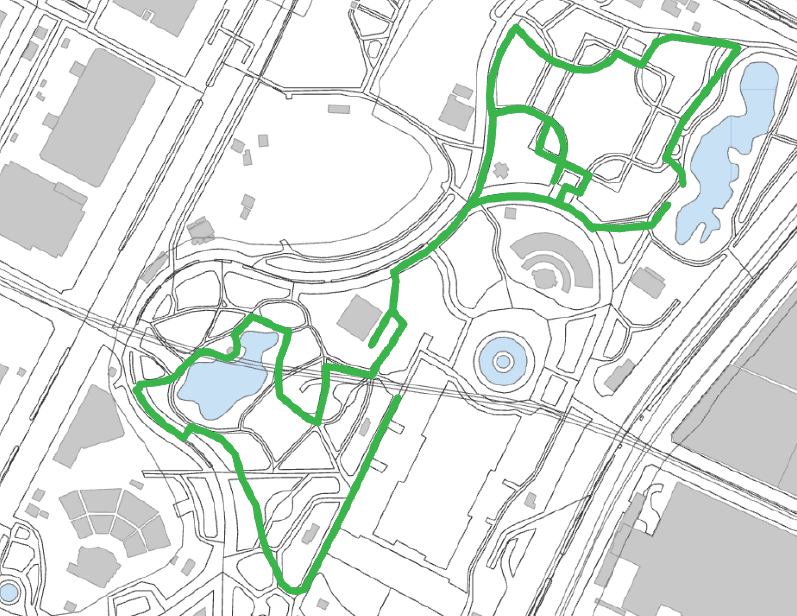
For this purpose, we first downloaded our graph data from [4] and used the pre-processing pipeline of [22], which filters out non-pedestrian ways (e.g., motorways, private drives). For each directed edge e ∈ E, we computed its distance by the Haversine formula between the two endpoints of e to approximate great-circle distance, and the resulting graph data was stored as a JSON file. Note that the orange edges in Fig. 1 correspond to this E. To navigate pedestrians, for simplicity, we assumed that the experiment routes are pre-designed, as illustrated in Fig. 3. Here, the entire route consists of two parts: (1) starting from (35.6735, 139.7549) and ending at (35.6745, 139.7580), and (2) starting from (35.6744, 139.7579) and ending at (35.6735, 139.7549).
In experiments, participants with smartphones and GPS devices (i.e., an RTK-GNSS (Real Time Kinematic-Global Navigation Satellite System) receiver) can walk along the displayed routes, where the map visualizes nearby items from VGI and UGC. Here, RTK-GNSS is a technology that provides highly accurate, centimeter-level positioning in real time by utilizing GNSS and network signals [23], [24]. Once a pedestrian enters the notifying area, set by the distance from the intersection, he/she receive the turning signal (e.g., turning right at the intersection) from his/her mobile device.
3.4 GPS Logging
To analyze users' behaviors, we stored smartphone locations of pedestrians and GPS log files to analyze the relationship between users' walking locations and the geographic data behind the application. We collected data from both Android and iOS smartphones to remove biases by using the route logging application from the same developer on both smartphones. Due to technological limitations, RTK-GNSS log data were recorded only for Android.
Using log data, we can evaluate positioning accuracy. Once the status gets 3D, the accuracy could range from 5[m] to 20[m]. After waiting a few minutes, the smartphone can detect its location using multiple satellites, saying 3D DGNSS for its status with an accuracy of being less than or equal to 1[m]. With our RTK-GNSS device, the system can detect its location with two different types of solutions called RTK Float and RTK Fixed. We can expect the accuracy of RTK Float to be roughly 0.1[m] and that of RTK Fixed to be roughly 0.01[m]. We expect that analyzing real GPS accuracies is critical to investigating walking experiences.
4. Findings
We report our findings through experiments.
4.1 Field Study and Measurements
We first assess whether the downloaded OSM data is durable for experiments. To observe the difference between the data and what we see in the real world, we developed the following hand-crafted process.
- ・We did our field survey from May to July 2024.
- ・We walked the pre-designed routes in Fig. 3.
- ・We equipped a battery-powered module (DG-PRO1RWS, Drogger) with a Helical antenna (HX-CH6605A, Drogger) and adopted a fixed station, AITOYA BASE, around Tokyo, Japan [25].
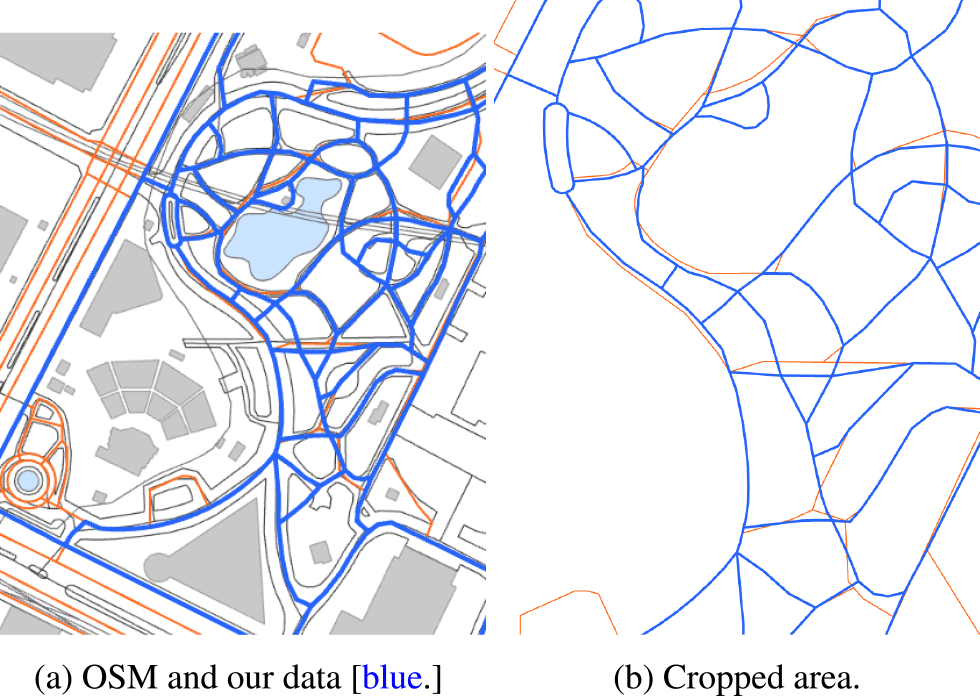
After collecting data, we manually modified the OSM graph in Fig. 1 to align it with the real locations using JOSM*2. We finally obtained our walkable graph, as illustrated by graphs with blue edges in Fig. 4a (its cropped area is shown in Fig. 4b). That is, we confirmed the mismatch in public data (i.e., OSM data) with real environments. We, therefore, need to discuss how this mismatch affects pedestrian navigation experiments. Note that the measured and modified data used and analyzed during the study are available on reasonable request.
4.2 GPS Quality
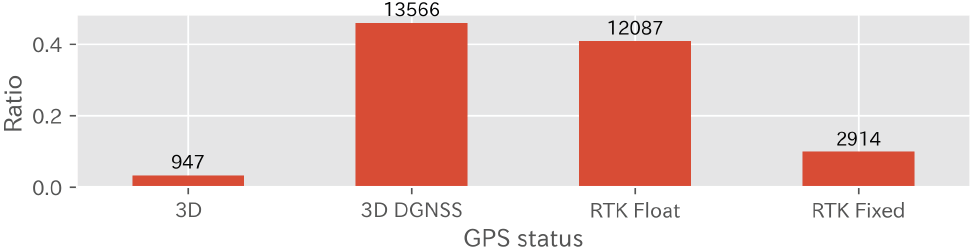
We next report GPS quality to make our field comparable with different areas. Our field test collected GPS log data during walking tests per participants (i.e., internal staff), and we analyzed them in a batch. Figure 5 shows the ratio of each GPS status out of all the collected data. Here, most data were 3D DGNSS or RTK Float. With the state-of-the-art, highest accuracy RTK-GNSS receiver, roughly half of the entire experiences were recorded at the best quality. In contrast, 48.6[%] of the points have the standard accuracy (3D/3D DGNSS). Therefore, in evaluating navigation experience in-the-wild, we need to assume inaccurate positioning (1[m] at best, which could cause critical problems with bad visibility). In some environments, 3D DGNSS could be enough, but in other environments, RTK Float could be required.
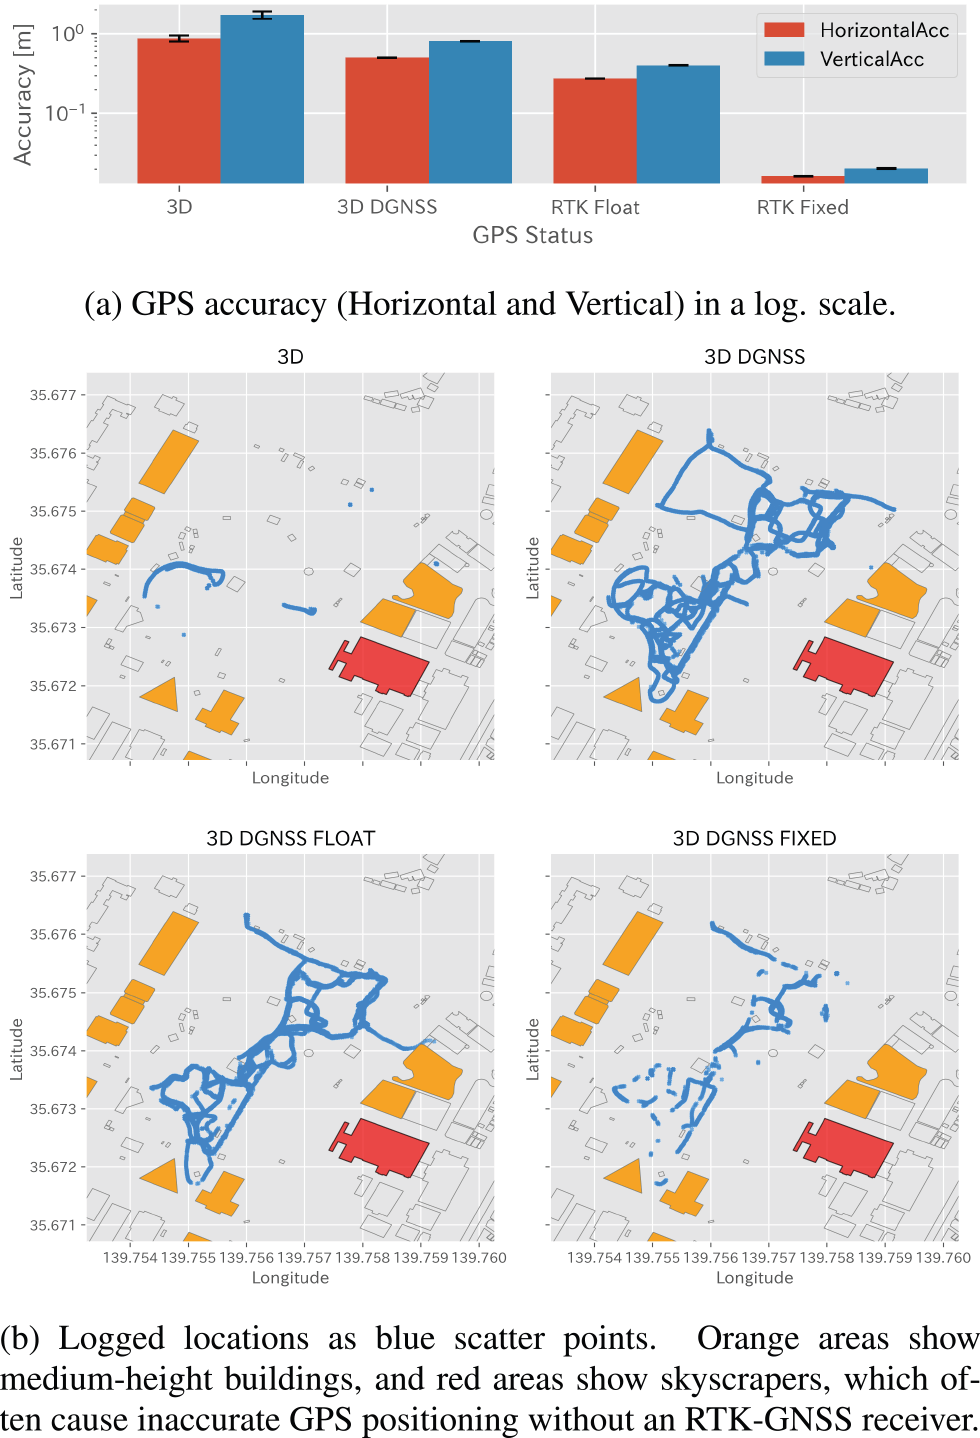
We also analyzed RTK-GNSS log data in detail. Figure 6a shows the reported accuracies (horizontal and vertical), where observed errors conformed to the expected specifications. Figure 6b shows how GPS signal quality varies spatially: high-rise buildings (red zones) tend to degrade positioning accuracy, particularly in dense urban parks like Hibiya. This spatial pattern underscores the importance of robust graph design that can accommodate positioning instability caused by environmental obstacles.
Even with the results of RTK Float, collected GPS logs clearly overlapped with small differences (i.e., blurred plots), likely due to minor positioning errors and variations in walking trajectories along the width of the route. This phenomenon invokes our discussion in Section 5.1 on how to prepare graph data for real-world environments. In addition, during experiments without the RTK-GNSS device, the sudden divergence of GPS locations and real locations was observed, particularly in areas with dense trees and high-rise buildings. Such conditions often confuse pedestrians who use navigation systems, making it difficult for them to intuitively determine their current location or which route to follow. These results highlight the necessity of highly accurate, well-organized and maintained VGI and UGC to support reliable, location-triggered experiences.
5. Discussions
Although our field test in Section 4 shows a promising direction to design scientific research environments by combining VGI and routing engines, we here discuss our findings towards future studies.
5.1 Graph Topology Design
As mentioned earlier, we encountered some missing roads or inaccurate edge locations; what OSM says does not match what we see. From these results, researchers may be required to assess the road network quality like ours, as in Section 4.1. We emphasize that our experiment, using hand-crafted data, was successfully completed without other issues, but the original OSM data was insufficient.
We also reveal the freedom of designing graphs tailored to each application. For example, when computing routes, a graph often lacks sufficient geographic accuracy and metadata (e.g., road width and a small plaza), as illustrated in Fig. 7 with two graphs. A coarse graph G1 is efficient for computation but not enough to represent accurate trajectories; a pedestrian cannot distinguish between the two sides of the road segment. A dense graph G2 is valuable for specialized requests (e.g., wheelchair users), but it is hard to maintain, and positioning accuracy limits the granularity (e.g., vertices cannot be distinguished). Furthermore, a public square in the park cannot be straightforwardly modeled by naive graphs.
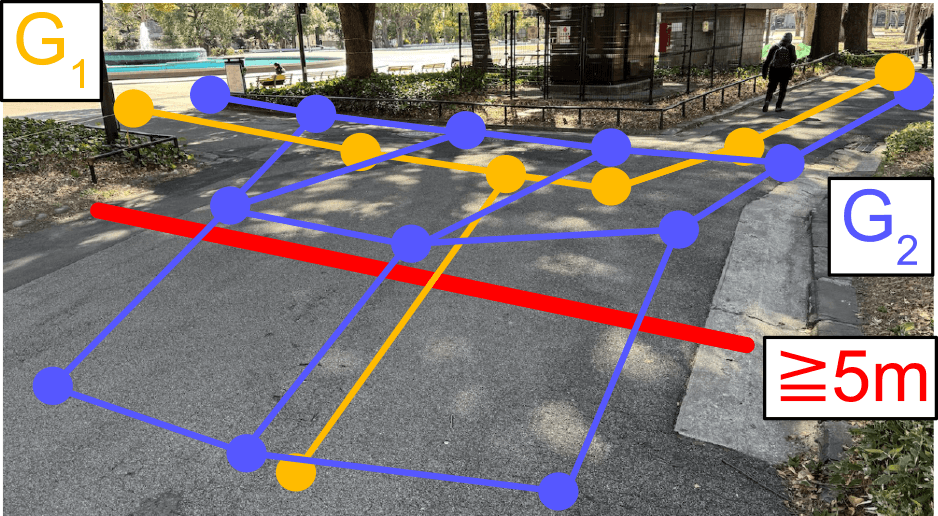
Our field experience here emphasizes the need to design graph topology, arrange metadata (e.g., tags in OSM), and link them to routing engines to address these requirements. These findings could be valuable to researchers designing open-sourced ecosystems [17].
5.2 Data Source
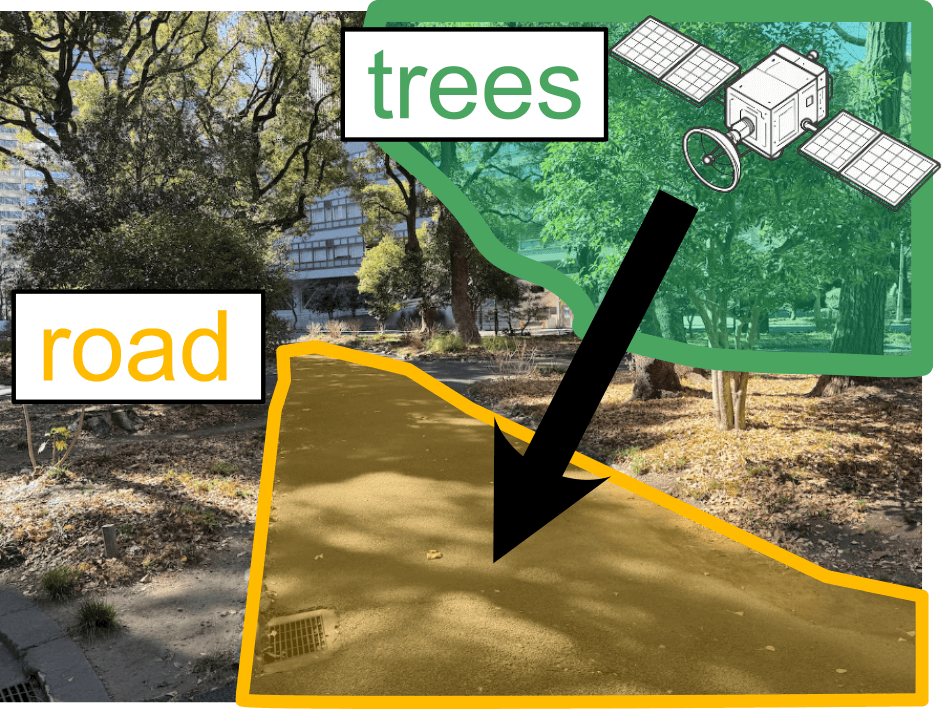
In general, OSM and other data sources are maintained by a combination of automatically extracted information (e.g., satellite imagery), professional data contributions (e.g., modification by human operators), and volunteer commitment (e.g., data labeling). Even with enriched graph attributes from them, we still need to care about the data quality.
Let us see an example in Fig. 8. Here, satellite imagery could generate inaccurate road segments and may be processed and registered in a data source. This conjecture was supported by our field study. When we measure road networks using our RTK-GNSS receiver in Section 4.1, some roads were not recorded in OSM at all. Some segments were stored in OSM, but their positions were incorrect, meaning that the topological features of roads were missing or did not match what we see. Thus, we should carefully modify public data to provide more precise and trustworthy data sources that are applicable to designing future mobility experiences.
We could operationalize fine-grained geographic data along three axes: (1) location accuracy (tolerance of horizontal offset), (2) topology granularity (graph resolution such as node spacing and area-internal links), and (3) attribute completeness (a minimum tag set required for a use case). For example, general pedestrian navigation may require location accuracy of less than or equal to 3[m], but more specialized use cases, such as wheelchair routing or point-triggered experiences, may demand higher accuracy (e.g., centimeter level, or at most 1[m]). In practice, coarse graphs (G1) are efficient but may miss side-of-road distinctions, while denser graphs (G2) or area representations are needed for specialized cases (see Fig. 7 and Section 5.1).
In summary, positioning accuracy affected not only users' smartphone locations but also the current OSM data quality. We need to continuously contribute to and manage geographic data, which aligns with previous literature on data assessment [5]. We also expect that recent gamified applications, such as Fog of World [26] and/or data-driven analyses of human mobility data (e.g., [27], [28]) can motivate researchers. Using such location-based applications, we believe that we can incrementally build and assess human mobility data. Furthermore, combining high-accuracy positioning with other vision-based techniques [29]-[32] is promising for designing experiences.
5.3 How to Enrich Mobility Experience
Although an RTK-GNSS receiver is expected to provide highly accurate location data, we encountered two practical issues: (1) equipping such a device in addition to a smartphone is cumbersome, and (2) its use is typically limited to specially prepared environments. Designing a mobility experience without such hardware constraints is preferable, yet technically challenging.
As shown in Fig. 9, linking location information with navigation events, such as turn-by-turn directions or nearby attraction notifications, is both important and non-trivial. To investigate the relationship between graph topology and navigation experiments, different styles can be discussed; For instance, as-the-crow-flies navigation [33] and greedy navigation strategies [34] can support intuitive wayfinding with minimal location dependence. We argue for evaluating these complex systems via in-the-wild experiments as well because such communication styles directly affect the mobility experiences of pedestrians.
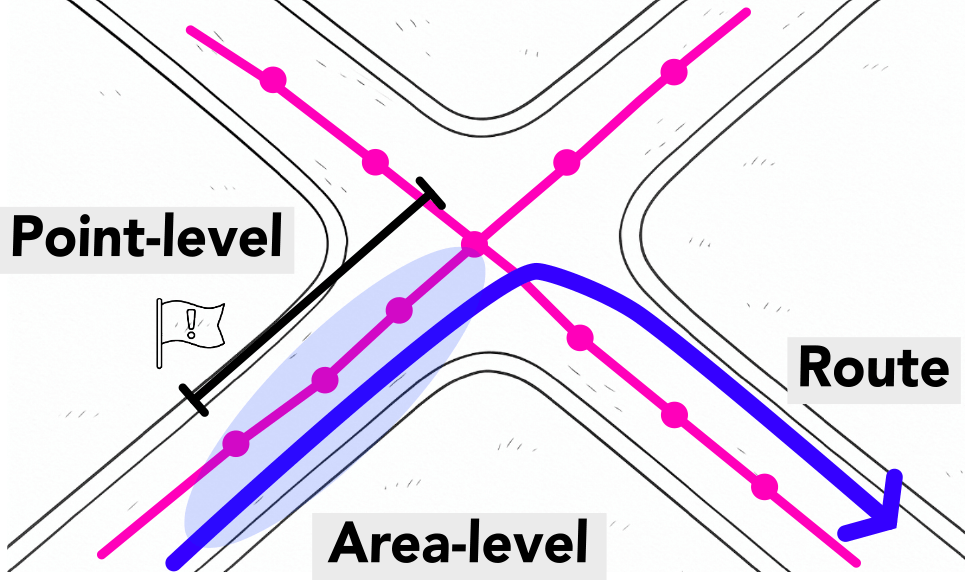
Another possible approach is aggregating noisy GPS data to coarse-grained clusters, involving using ordinal (low-precision) GPS signals combined with geographic abstractions, such as geofences [35], [36], to track user movement at the area level rather than at specific points. Accumulating GPS raw points to form clusters can help reduce noise and improve event timing (e.g., when to trigger a notification). However, these methods also suffer from limitations in event detection accuracy (e.g., identifying whether a user has entered a cluster), which may significantly impair experience quality in our target environments.
To move toward deployable mobility systems, future work should explore lightweight positioning techniques, such as sensor fusion with smartphone IMUs, map-matching algorithms involving digital twin models. These combinations can complement or replace RTK-GNSS in public scenarios. These approaches, when combined with more expressive graph topologies (e.g., incorporating small plazas or informal routes) and the detailed models, offer promising directions for future research on mobility systems grounded in complex, personalized, and real-world environments.
6. Conclusions
We demonstrated whether or not publicly available VGI is durable to study pedestrian navigation in-the-wild environments, i.e., outside of laboratories. To highlight the critical role of geographic data quality management in designing mobility experiences, we conducted experiments and collected location data from pedestrians, and analyzed the data to discuss the technical limitations. Our results show the insufficient situation of current data sources and highlight three possible perspectives for evaluating pedestrian navigation systems in-the-wild. Although our study is limited to a specific in-the-wild setting in one country, we believe that our findings can help accelerate future research and foster broader discussions on developing sophisticated mobility experiences supported by maintained geographic data.
References
- [1] Siriaraya, P., Wang, Y., Zhang, Y., Wakamiya, S., Jeszenszky, P., Kawai, Y. and Jatowt, A.: Beyond the shortest route: A survey on quality-aware route navigation for pedestrians, IEEE Access, Vol.8, pp.135569–135590 (2020).
- [2] Boeing, G.: OSMnx: New methods for acquiring, constructing, analyzing, and visualizing complex street networks, Computers, Environment and Urban Systems, Vol.65, pp.126–139 (2017).
- [3] Miranda, A. S., Fan, Z., Duarte, F. and Ratti, C.: Desirable streets: Using deviations in pedestrian trajectories to measure the value of the built environment, Computers, Environment and Urban Systems, Vol.86, p.101563 (2021).
- [4] OpenStreetMap contributors: Planet dump retrieved from 〈https://planet.osm.org〉, 〈https://www.openstreetmap.org〉 (2017).
- [5] Senaratne, H., Mobasheri, A., Ali, A. L., Capineri, C. and Haklay, M.: A review of volunteered geographic information quality assessment methods, International Journal of Geographical Information Science, Vol.31, No.1, pp.139–167 (2017).
- [6] Arsanjani, J. J., Barron, C., Bakillah, M. and Helbich, M.: Assessing the quality of OpenStreetMap contributors together with their contributions, Proceedings of AGILE2013, pp.14–17 (2013).
- [7] Biljecki, F., Chow, Y. S. and Lee, K.: Quality of crowdsourced geospatial building information: A global assessment of OpenStreetMap attributes, Building and Environment, Vol.237, p.110295 (2023).
- [8] Kounadi, O.: Assessing the quality of OpenStreetMap data, Msc geographical information science, University College of London Department of Civil, Environmental And Geomatic Engineering, p.19 (2009).
- [9] Mooney, P., Corcoran, P. and Winstanley, A. C.: Towards quality metrics for OpenStreetMap, Proceedings of ACM SIGSPATIAL2010, pp.514–517 (2010).
- [10] Suga, M., Nurata, Y. and Nakaminami, K.: Experimental Release of “Japan Map in Multilingual Notation” Using Vector Tile Data, Bulletin of the Geospatial Information Authority of Japan, Vol.67 (2021).
- [11] Geospatial Information Authority of Japan: Experimental release of Japan map in multilingual notation, 〈https://www.gsi.go.jp/kokusaikoryu/kokusaikoryu-e31032.html〉.
- [12] Geospatial Information Authority of Japan: Geospatial Information Authority of Japan (GSI)Website Terms of Use, 〈https://www.gsi.go.jp/ENGLISH/page_e30286.html〉.
- [13] Digital Agency: Public Data License (Version 1.0), 〈https://www.digital.go.jp/en/resources/open_data/public_data_license_v1.0〉.
- [14] Delling, D., Sanders, P., Schultes, D. and Wagner, D.: Engineering route planning algorithms, Algorithmics of Large and Complex Networks, Springer, pp.117–139 (2009).
- [15] Bast, H., Delling, D., Goldberg, A., Müller-Hannemann, M., Pajor, T., Sanders, P., Wagner, D. and Werneck, R. F.: Route planning in transportation networks, Algorithm Engineering, Springer, pp.19–80 (2016).
- [16] Torres, M., Pelta, D. A. and Verdegay, J. L.: PRoA: An intelligent multi-criteria personalized route assistant, Engineering Applications of Artificial Intelligence, Vol.72, pp.162–169 (2018).
- [17] Eggerth, A., Argota S'anchez-Vaquerizo, J., Helbing, D. and Mahajan, S.: Democratizing Urban Mobility Through an Open-Source, Multi-Criteria Route Recommendation System, Proceedings of RecSys2024, pp.1073–1078 (2024).
- [18] Giraud, T.: OSRM: Interface Between R and the OpenStreetMap-Based Routing Service OSRM, Journal of Open Source Software, Vol.7, No.78, p.4574 (2022).
- [19] Ohwada, H., Okada, M. and Kanamori, K.: Flexible route planning for amusement parks navigation, Proceedings of ICCI*CC2013, pp.421–427 (2013).
- [20] Baker, K. and Verstockt, S.: Cultural heritage routing: a recreational navigation-based approach in exploring cultural heritage, Journal on Computing and Cultural Heritage, Vol.10, No.4, pp.1–20 (2017).
- [21] Ludwig, B., Donabauer, G., Ramsauer, D. and Subari, K. a.: Urwalking: Indoor navigation for research and daily use, KI-Künstliche Intelligenz, Vol.37, No.1, pp.83–90 (2023).
- [22] Otaki, K., Maeda, T., Yoshimura, T. and Sakai, H.: Roaming Navigation: Diverse Constrained Paths Using Heuristic Search, IEEE Access, Vol.11, pp.75617–75627 (2023).
- [23] Wanninger, L.: Introduction to network RTK, IAG Working Group, Vol.4, No.1, pp.2003–2007 (2004).
- [24] El-Mowafy, A.: Precise real-time positioning using Network RTK, Global Navigation Satellite Systems: Signal, Theory and Applications, Vol.7, pp.161–188 (2012).
- [25] AITOYA, Inc.: AITOYA BASE, 〈https://ntrip.aitoya.net/〉 (accessed 2025/9/16).
- [26] Apps, O.: 〈https://fogofworld.app/〉 (2012).
- [27] Züfle, A., Pfoser, D., Wenk, C., Crooks, A., Kavak, H., Anderson, T., Kim, J.-S., Holt, N. and Diantonio, A.: In Silico Human Mobility Data Science: Leveraging Massive Simulated Mobility Data (Vision Paper), ACM Transactions on Spatial Algorithms and Systems, Vol.10, No.2, pp.1–27 (2024).
- [28] Pappalardo, L., Manley, E., Sekara, V. and Alessandretti, L.: Future directions in human mobility science, Nature Computational Science, Vol.3, No.7, pp.588–600 (2023).
- [29] Taketomi, T., Uchiyama, H. and Ikeda, S.: Visual SLAM algorithms: A survey from 2010 to 2016, IPSJ Transactions on Computer Vision and Applications, Vol.9, No.1, p.16 (2017).
- [30] Treuillet, S. and Royer, E.: Outdoor/indoor vision-based localization for blind pedestrian navigation assistance, International Journal of Image and Graphics, Vol.10, No.04, pp.481–496 (2010).
- [31] Siagian, C., Chang, C.-K. and Itti, L.: Mobile robot navigation system in outdoor pedestrian environment using vision-based road recognition, Proceedings of ICRA2013, IEEE, pp.564–571 (2013).
- [32] Dong, W. and Liao, H.: Eye tracking to explore the impacts of photorealistic 3d representations in pedstrian navigation performance, The International Archives of the Photogrammetry, Remote Sensing and Spatial Information Sciences, Vol.41, pp.641–645 (2016).
- [33] Savino, G.-L., Meyer, L., Schade, E. E. S., Tenbrink, T. and Schöning, J.: Point me in the right direction: understanding user behaviour with as-the-crow-flies navigation, Proceedings of MobileHCI2020, pp.1–11 (2020).
- [34] Lee, S. H. and Holme, P.: Exploring Maps with Greedy Navigators, Physical Review Letters, Vol.108, p.128701 (2012).
- [35] Shevchenko, Y. and Reips, U.-D.: Geofencing in location-based behavioral research: Methodology, challenges, and implementation, Behavior Research Methods, Vol.56, No.7, pp.6411–6439 (2024).
- [36] Sasaki, I., Arikawa, M., Lu, M., Utsumi, T. and Sato, R.: Geofence-to-Conversation: Hierarchical Geofencing for Augmenting City Walks with Large Language Models, Adjunct Proceedings of Mobile-HCI2024, pp.1–5 (2024).
脚注
- *1 Hibiya Park, Chiyoda-ku, Tokyo, 100–0012, Japan.
- *2 https://josm.openstreetmap.de/

otaki@mosk.tytlabs.co.jp
Keisuke Otaki received the Ph.D. degree in informatics from Kyoto University, in 2016. He is currently a Researcher with Toyota Central R&D Labs., Inc., Japan. His current research interests include data-driven methods and mathematical aspects of human mobility science.

tmaeda@mosk.tytlabs.co.jp
Tomosuke Maeda is a researcher at Toyota Central R&D Labs., Inc., Collaborative Intelligence Research Domain. He received his Master's (2017) degree and Ph.D. (2025) in Media Design from Keio University Graduate School of Media Design (KMD). His current research interests are haptic interfaces, embodied interactions, and mobility experiences.

yoshimura@mosk.tytlabs.co.jp
Takayoshi Yoshimura received the B.S. degree from the Department of Computer Science, Nagoya Institute of Technology (NIT), Japan, in 1997, and the M.Eng. and Dr.Eng. degrees from the Department of Electrical and Computer Engineering, NIT, in 1999 and 2002, respectively. He is currently a Senior Researcher with Toyota Central R&D Labs., Inc., Japan. His research interests include cyber-physical systems and their applications.
採録日 2025年10月14日