A Web-Based Geographical Information System Integrated with a Deep Learning Model for Individual Oil Palm Mapping Using RGB Drone Imagery
1.Drone- and GIS-based Solutions for Oil Palm Plantation Management
Oil palm (Elaeis guineensis Jacq.) is a major export commodity used to produce margarine, cooking oil, biodiesel and other oleochemical products [1]. Indonesia has the largest oil palm plantation area in the world. In 2023, the plantation area reached 16.83 million hectares, producing 47.08 million tons of palm oil [2]. The highest production was recorded in several provinces, including Riau (9.22 million tons or 19.59%), Central Kalimantan (8.47 million tons or 17.98%), among others [3]. In Indonesia, oil palm producers are dominated by private estates (60.88%), followed by smallholders (34.46%) and state-owned estates (4.67%).
Sustainable management of oil palm plantations is challenging due to the limited availability of well-structured data to support decision-making and technical staff in the field [3][4]. Structured data play an important role, particularly in daily plantation activities such as pest control, fertilizer application, harvesting, and fresh fruit bunch (FFB) production. An effective data management system is crucial for resource allocation, labor efficiency, cost optimization, and fertilizer use [5]. A geographical information system (GIS) plays an important role on oil palm plantation management for data collection to decision-making activities[6].
GIS is a system that can manage spatial and non-spatial information in a robust framework for data management and storage. Spatial data in oil palm plantations include the location of palm trees, block polygons, estate boundaries, raster datasets from drones, and other spatial information. Non-spatial data include tree health conditions, fertilizer use, fruit bunch production, and other attributes [5].
Currently, implementation of web-GIS is also beneficial, providing an easy-to-use system capable of collaborative utilization by various actors in the plantation, such as managers, field operators, and owners. The use of drone images is also important for obtaining up-to-date plantation information. RGB drone imagery is now more accessible and affordable compared to multispectral datasets [8]. Despite being less advanced, RGB imagery remains useful and easy to capture. When integrated with a deep learning model, RGB imagery can detect oil palm trees and digitize individual trees with their geographic coordinates (latitude, longitude). Flight image overlap is an important parameter for ensuring image quality and orthomosaicking [7][8]. Drones are also used for pesticide delivery with smart control systems[9]. The integration of spatial and non-spatial information with deep learning models is a cutting-edge application in oil palm plantation management [10].
Several previous studies have addressed the use of drones and deep learning in plantations [3]. A YOLO-based deep learning algorithm was developed to detect the trees on the plantation and achieve high accuracy [11][12]. Deep learning algorithms using RGB imagery have shown strong potential in tree detection. The performance of the YOLO model has been optimized and evaluated to ensure robustness in palm tree recognition [13][14]. YOLO unifies separate detection components into a single convolutional network, allowing the model to simultaneously predict bounding boxes and class probabilities across an entire image grid [15]. This end-to-end architecture makes YOLO particularly suitable for UAV imagery, where large-scale object localization must be performed efficiently [16]. Based on the previous research, it can be concluded that drones integrated with deep learning models have been successfully applied in plantation areas to monitor the visual condition of the oil palm.
However, accessing such models for plantation management remains challenging. Web-based GIS plays an important role in oil palm plantation management, supporting good agricultural practices through systems that are easy to use [17]. A web-based system typically consists of backend code for data access and user interfaces for practical utilization [8].
Nevertheless, research integrating GIS with deep learning models for individual tree mapping and dataset visualization on a single platform remains limited. This study proposes a web-based GIS to manage oil palm plantation data, where individual trees are detected and digitized using a deep learning model.
2.Materials and Methods
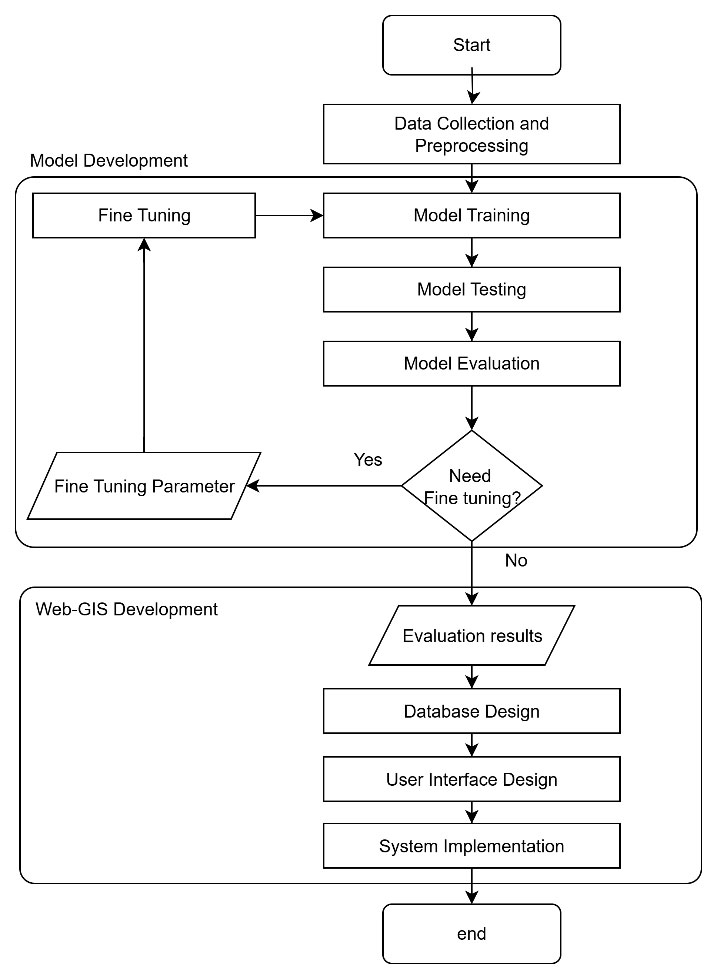
The methodology of this research involved several sequential stages, including data acquisition, model development, and Web-GIS development. To provide a clear overview of these processes, the overall workflow of the study is summarized in a flowchart (Figure 1).
2.1 Data Acquisition
A spatial and non-spatial dataset was collected from an oil palm plantation at Jonggol, Bogor Regency, West Java, Indonesia (Figure 2). The cultivation data, as a non-spatial dataset, consisted of the year of planting, number of standing trees, fertilizer usage, and harvest information. These data were integrated with spatial data, which consisted of block polygons and raster data. The planting layout in this plantation followed a 9.2 × 9.2 meter spacing, resulting in approximately 136 oil palm trees per hectare.
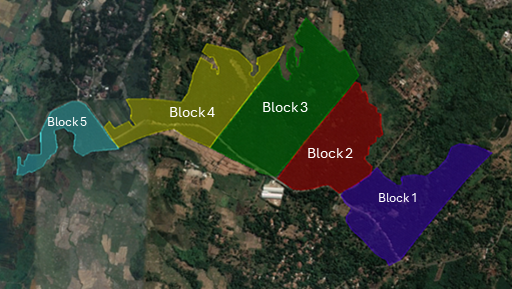
A spatial dataset consisting of block polygons and red, green, and blue (RGB) raster images was collected using a DJI Mavic 3 multispectral drone. The plantation consisted of five blocks, used for production, research, and training. Drone images were captured at an altitude of 75 meters with 85% overlap, resulting in a total of 7,333 images (Table 1).
| Block | Area (ha) | Number of Trees |
|---|---|---|
| Block 1 | 7 | 1,449 |
| Block 2 | 11 | 1,430 |
| Block 3 | 17 | 2,335 |
| Block 4 | 13 | 1,373 |
| Block 5 | 5 | 734 |
| Total | 53 | 7,333 |
2.2 Data Pre-Processing
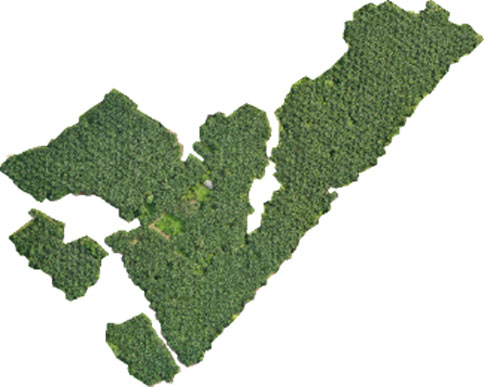
Tabular data were integrated with spatial data (individual tree coordinates, block polygons, and roads) using QGIS software. A total of 7,333 RGB drone images were processed using the stitching software PIX4Dmapper to generate an orthomosaic dataset. The RGB values were then used to assess the condition of the oil palm trees (Figure 3).
Raster RGB images, which had been clipped, resized, and georeferenced during preprocessing, were used as the dataset for model development.
2.3 Deep Learning Model Development
The You Only Look Once (YOLO) version 8 deep learning model was used to detect oil palm trees. The model development for the automatic oil palm tree detector consisted of dataset preparation, model training, validation, and testing.
2.3.1 Dataset Preparation
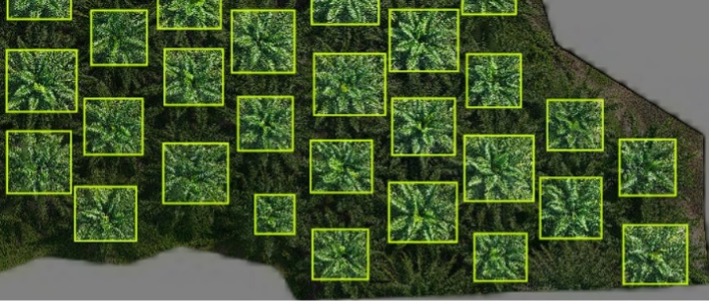
The dataset was annotated using Roboflow software, with bounding boxes indicating trees for detection (Figure 4). Figure 4 shows a sample of the annotated dataset used for model development. Datasets from multiple blocks were randomly distributed to achieve the highest model accuracy. A total of 1,449 images from Block 1 were used for model training, while images from Blocks 2, 3, and 4 were used for validation and testing. The dataset was partitioned into training (80%), validation (10%), and testing (10%) to achieve the best performance.
2.3.2 Training, Validation and Testing
The dataset from several blocks was randomly distributed to achieve the highest model accuracy. A total of 1,449 datasets were used to train the model. The dataset was divided into training, testing and validation datasets with proportions 80%, 10% and 10%, respectively. Figure 4 shows an annotated dataset.
\(Accuracy=\frac{TP+TN}{TP+FP+FN+TN}\) |
(1) |
\(Precision=\frac{TP}{TP+FP}\) |
(2) |
\(F1\ score=2\times\frac{Precision\times Recall}{Precision+Recall}\) |
(3) |
Where:
TP: true positives, FP: false positives, TN: true negatives (TN), and FN: false negatives.
2.3.3 Geospatial Integration
The model’s output appeared as bounding boxes around the crowns of oil palm trees. Because these boxes were generated in image coordinate space, they were converted into spatial coordinates using an affine transformation. The centroid of each box was then extracted and transformed into vector polygon geometries with the help of Python libraries such as Shapely, GeoPandas, and NumPy.
2.4 Web-GIS development
2.4.1 Database Design
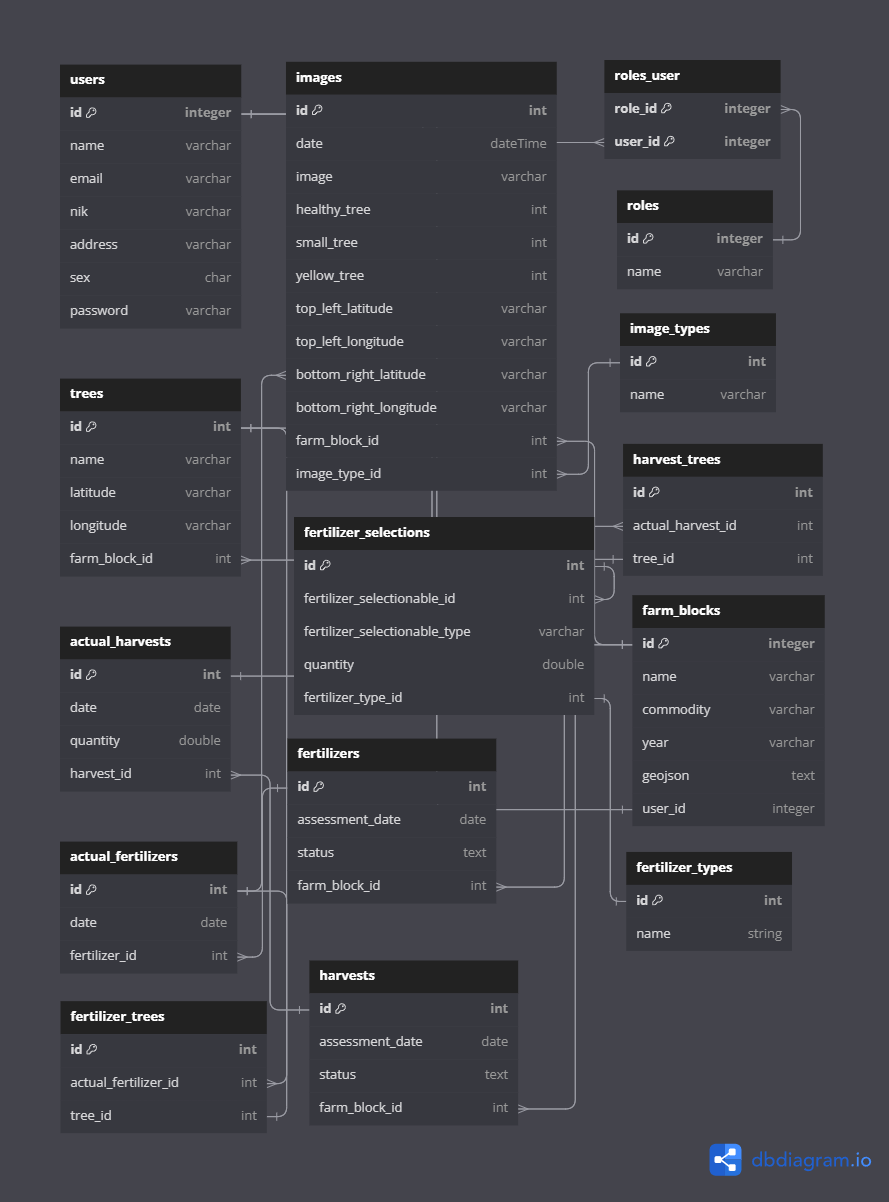
To deliver these functions, the database was organized into several key domains covering user accounts, plantation blocks, tree inventories, and operational activities. The structure was outlined in an entity–relationship diagram (ERD), which illustrated the connections among datasets to support faster queries and minimize data redundancy (Figure 5). Integration between tabular records (e.g., fertilizer use, harvest tonnage) and spatial datasets (e.g., polygons of tree crowns) allowed managers to analyze plantation conditions holistically.
2.4.2 User Interface Design
The interface design process began with Figma, where wireframes and mockups were prepared before actual development. The layout prioritizes ease of use and readability, offering dashboards that summarize key information alongside interactive maps for spatial navigation. Plantation managers can filter activities based on time, block, or type of operation and can also enter new records directly through the system. Beyond visualization, the system integrates geoprocessing functions, including tree-level queries, block-based statistical summaries, and real-time map updates from the geospatial database. This functionality ensures that plantation managers have timely and accurate data for planning and resource allocation. The design prioritizes interoperability, ensuring that the system can communicate with other data services and adapt to future enhancements.
2.4.3 Web Interface Development
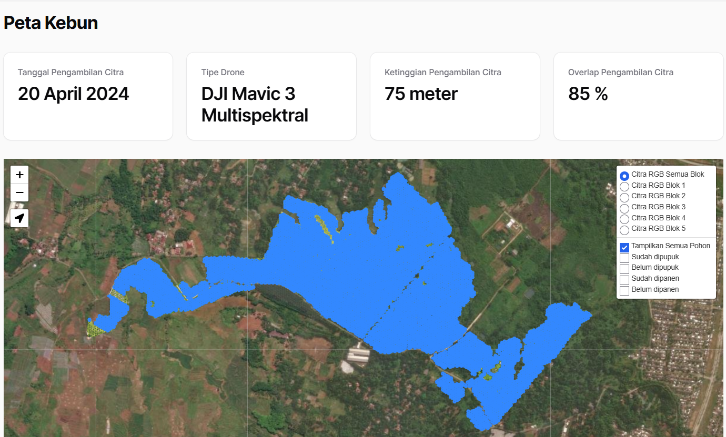
The Web-GIS system was developed to integrate spatial and non-spatial plantation data into an interactive and accessible platform for plantation managers (Figure 6). The system was designed to operate at multiple levels of plantation management:
Plantation level: displays overall maps, block boundaries, and key infrastructure.
Block level: provides information on tree density, fertilizer distribution, herbicide application, and harvesting records.
Individual tree level: provides detailed information such as geographic location, health status estimated from NDVI values, and records of plantation activities, including fertilization and harvesting.
3.Results and Discussion
3.1 Deep Learning Model Performance Evaluation
3.1.1 Training Performances
YOLOv8 was implemented using the Python and trained using annotated datasets. The result of YOLOv8 training showed consistent and robust performance. Box loss, classification loss, and distribution focal loss (DFL) significantly decreased from the beginning to the end of training. Box loss decreased from approximately 2.0 to 0.8, showing an improvement in model performance. Classification loss decreased from 1.4 to about 0.2, indicating that the model achieved higher accuracy. The value of DFL loss decreased from 1.6 to about 0.7-0.8 confirming that the model gradually improved in predicting bounding boxes.
Based on precision performance, the model achieved 1.0 after 20 epochs, underlining that positive predictions were correct, minimizing false positives. At the same time, the recall value remained stable, ranging from 0.92 to 0.94, indicating that more than 90% of objects were successfully detected. Overall, the model learned effectively and achieved high accuracy during the training process (Figure 7).

3.1.2 Model Validation
The performance of the model was evaluated using precision, recall, F1 score, and accuracy, with values of 100%, 97.37%, 98.68%, and 97.37%, respectively (Table 2). These results demonstrate that the model achieved an accuracy of 97.37%, indicating that nearly all predictions matched the ground truth. Precision reached 100%, meaning that every detected tree corresponded to an actual oil palm crown, with no false positives. This is particularly important in large-scale monitoring, as overestimation due to false positives could lead to resource misallocation. Meanwhile, recall of 97.37% shows that almost all existing trees were successfully detected, with only a small fraction missed. The F1-score of 98.67%, which balances precision and recall, highlights the strong consistency and robustness of the model.
In addition to these metrics, the model's performance was further validated using mean Average Precision (mAP) indicators. The mAP50 score reached 0.96558, indicating excellent detection accuracy at the 50% Intersection over Union (IoU) threshold. Moreover, the mAP50-95 score was 0.82132, reflecting the model's reliability across a range of IoU thresholds from 50% to 95%. These high mAP values reinforce the effectiveness of the YOLOv8 model in accurately and consistently identifying oil palm trees in complex scenarios.
| Metric | Value (%) |
|---|---|
| Precision | 100.00 |
| Recall | 97.37 |
| F1-score | 98.67 |
| Accuracy | 97.37 |
| mAP50 | 0.96558 |
| mAP50-95 | 0.82132 |
| IoU | 50% |
This model was also tested using another dataset from the plantation area to check its performance. Figure 8 shows the detected oil palm trees using the developed models.
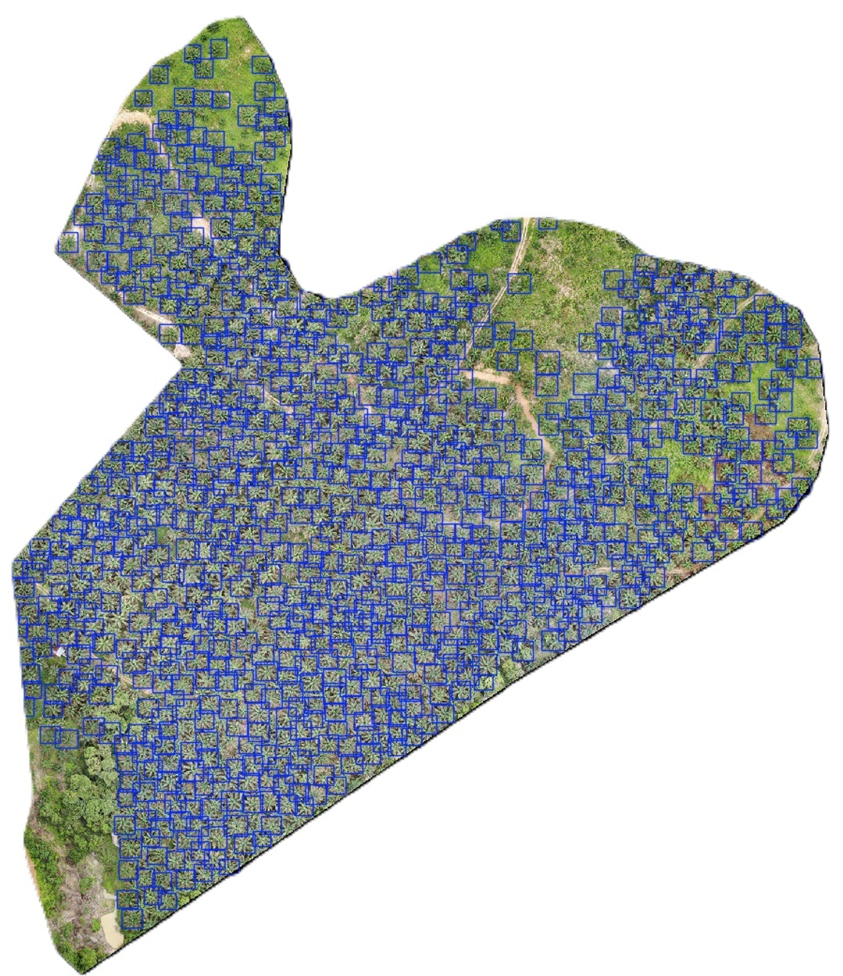
Table 3 shows the performance of the YOLOv8 model implemented in other oil palm plantations. The models are still able to be used with a good performance with precision (98.13%), recall (98.75%), F1-score (98.42%), accuracy (96.42%), mAP50 (98.44%), mAP50-95 (93.4), and IoU (50%).
| Metric | Value (%) |
|---|---|
| Precision | 98.13 |
| Recall | 98.75 |
| F1-score | 98.42 |
| Accuracy | 96.93 |
| mAP50 | 98.44 |
| mAP50-95 | 93.4 |
| IoU | 50% |
In addition to numerical evaluation, qualitative assessment was conducted by visually inspecting detection results overlaid on the ortho mosaic imagery. As shown in Figure 9, the bounding boxes generated by YOLOv8 were consistently positioned over actual canopy locations, confirming that the model produces statistically strong and spatially meaningful outputs.

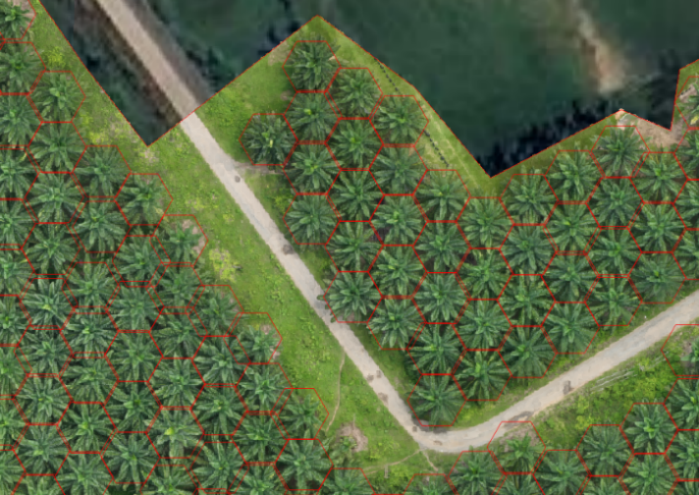
These bounding boxes were converted into polygon geometries delineating the canopy boundaries to enhance spatial representation. The conversion process, performed using affine transformation and spatial libraries, is illustrated in Figure 10, where the polygon outlines closely match the visible palm crowns. The resulting polygon layers were subsequently integrated into the geospatial database, enabling detection outputs to connect directly with plantation management datasets.
The combined quantitative and qualitative results provide strong evidence that the YOLOv8 framework can detect oil palm crowns with high reliability. With a precision of 100% and a recall above 97%, the model minimizes both false and missed detections, making it a reliable tool for generating automated population databases. This performance ensures that deep learning outputs can be confidently integrated into the Web-GIS system to support plantation monitoring, resource allocation, and precision agriculture practices.
3.2 Usability Testing
A usability evaluation was carried out using the System Usability Scale (SUS) to examine how users interacted with the developed Web-GIS system. The system was evaluated by ten (10) respondents,including managers and plantation staff at Jonggol, IPB University plantation, Bogor Regency, Indonesia. Based on the evaluation the averages SUS score 62.5, indicating that the system achieves a good baseline value, with room for improvements in the future.
Figure 11 shows the distribution of responses across the SUS questionnaire items. The variation in user feedback highlights the strengths and weaknesses of the current implementation. Positive feedback was generally directed toward the functionality of the spatial visualization and activity management modules, whereas lower scores were observed in aspects related to the interface intuitiveness and navigation simplicity.
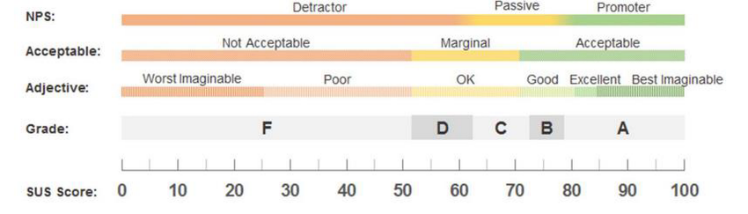
The results indicate that, while the developed Web-GIS platform is operational and meets basic requirements for plantation monitoring, further development is necessary to improve its usability. Enhancements in user interface design, workflow simplification, and more responsive visualization are recommended to increase the overall SUS score in future iterations.
4.Conclusion and Future Works
4.1 Integration of Deep Learning-Based Tree Detection with a Web-GIS Platform
This study successfully integrated a deep learning model using RGB imagery for tree detection and developing a web-GIS platform was successfully implemented in a system. The orthomosaic images, block data, geographic locations of the trees, and other information were integrated into the web-GIS platform. The performance of YOLOv8 in detecting trees was evaluated with an accuracy of 97.37%, a precision of 100%, a recall of 97.37%, and an F1-score of 98.67%, ensuring the reliability of automated tree population mapping.
Usability testing through the System Usability Scale (SUS) resulted in a score of 62.5, indicating that while the system is functional and applicable, further interface design and navigation improvements are needed to increase user satisfaction. The novelty of this study lies in combining UAV-based deep learning detection with a Web-GIS management system in an operational plantation setting, bridging advanced remote sensing techniques with practical decision-making tools. This research improved the previous web-based application with a deep learning model for plant detection and counting.
4.2 Future Perspectives on Accuracy, Usability, and Large-Scale Deployment
Nevertheless, several limitations remain, particularly regarding overlapping canopies, illumination effects on detection, and user interface design. Future work should focus on enhancing system usability, incorporating advanced vegetation indices, integrating IoT-based field sensors, and extending deployment to larger and more heterogeneous plantation areas. The system's computational speed performance should be improved for large-scale applications in Indonesian oil palm plantations. The computational time for raster data processing should be considered due to the large size of the data.
5.Acknowledgments
We would like to acknowledge Faculty of Agriculture for supporting the oil palm plantation during data collection. We thank the Directorate of Agromaritime Community Development, IPB University for providing drone facilities for data acquisition.
References
- 1)Kementerian Pertanian : Statistik Perkebunan 2023-2025, Sekretariat Direktorat Jenderal Perkebunan, pp.1–1080 (2024).
- 2)Badan Pusat Statistik Indonesia : Statistik Kelapa Sawit Indonesia 2023, Badan Pusat Stastik, Vol.17, pp.85 (2024).
- 3)FAO : Agricultural Production Statistics 2010-2023, FAOSTAT Analytical Briefs, No.96. Rome, pp.1–17 (2024).
- 4)Puspitasari, P. S. D., Kurniasari, A. A. and Puspitasari, T. D. : Geographic Information System Mapping of Plantation, Journal of Applied Science, Engineering, Technology, and Education, Vol.4, No.2, pp.210–222 (2022), doi: 10.35877/454RI.asci1162
- 5)Putra, B. T. W., Soni, P., Marhaenanto, B., Pujiyanto, Harsono, S. S. and Fountas, S. : Using Information From Images for Plantation Monitoring: A Review of Solutions for Smallholders, Information Processing in Agriculture, Vol.7, No.1, pp.109–119 (2020), doi: 10.1016/j.inpa.2019.04.005
- 6)Rustiadi, E. et al. : Developing a Precision Spatial Information System of Smallholder Oil Palm Plantations for Sustainable Rural Development, IOP Conference Series: Earth and Environmental Science, Vol.1133, No.1, pp.0–12 (2023), doi: 10.1088/1755-1315/1133/1/012072
- 7)Hutagalung, J. : Perancangan Sistem Informasi Pengolahan Data Tanaman Kelapa Sawit, Jurnal Teknologi Sistem Informasi dan Sistem Komputer TGD, Vol.4, No.2, pp.196–203 (2021).
- 8)Wibowo, H., Sitanggang, I. S., Mushthofa, M. and Adrianto, H. A. : Large-Scale Oil Palm Trees Detection From High-Resolution Remote Sensing Images Using Deep Learning, Big Data and Cognitive Computing, Vol.6, No.3, pp.89 (2022), doi: 10.3390/bdcc6030089
- 9)Fawcett, D., Azlan, B., Hill, T. C., Kho, L. K., Bennie, J. and Anderson, K. : Unmanned Aerial Vehicle (UAV) Derived Structure-from-Motion Photogrammetry Point Clouds for Oil Palm (Elaeis Guineensis) Canopy Segmentation and Height Estimation, International Journal of Remote Sensing, Vol.40, No.19, pp.7538–7560 (2019), doi: 10.1080/01431161.2019.1591651
- 10)Chen, J. et al. : Weed Detection in Sesame Fields Using a YOLO Model With an Enhanced Attention Mechanism and Feature Fusion, Computers and Electronics in Agriculture, Vol.202, pp.107412 (2022) doi: 10.1016/j.compag.2022.107412
- 11)Li, W., Fu, H., Yu, L. and Cracknell, A. : Deep Learning Based Oil Palm Tree Detection and Counting for High-Resolution Remote Sensing Images, Remote Sensing, Vol.9, No.1, p.22 (2016), doi: 10.3390/rs9010022
- 12)Shaikh, I. M., Akhtar, M. N., Aabid, A. and Ahmed, O. S. : Enhancing Sustainability in the Production of Palm Oil: Creative Monitoring Methods Using YOLOv7 and YOLOv8 for Effective Plantation Management, Biotechnology Reports, Vol.44, p.e00853 (2024), doi: 10.1016/j.btre.2024.e00853
- 13)Seifert, E. et al. : Influence of Drone Altitude, Image Overlap, and Optical Sensor Resolution on Multi-View Reconstruction of Forest Images, Remote Sensing, Vol.11, No.10 (2019), doi: 10.3390/rs11101252
- 14)Charloq, Thoha, A. S., Yazid, A., Sidiq, A. M. and Lubis, O. A. : Estimating Oil Palm (Elaeis Guineensis) Production Potential Using Unmanned Aerial Vehicle, Biodiversitas, Vol.25, No.9, pp.2981–2989 (2024), doi: 10.13057/biodiv/d250919
- 15)Wahyutama, A. B. and Hwang, M. : YOLO-Based Object Detection for Separate Collection of Recyclables and Capacity Monitoring of Trash Bins, Electronics (Switzerland), Vol.11, No.9 (2022), doi: 10.3390/electronics11091323
- 16)Redmon, J., Divvala, S., Girshick, R. and Farhadi, A. : You Only Look Once: Unified, Real-Time Object Detection Joseph, Proceedings of the IEEE Conference on Computer Vision and Pattern Recognition (CVPR), pp.779–788 (2016), doi: 10.1109/CVPR.2016.91
- 17)Darmawan, S., Hernawati, R., Hariandi, F., Wiratmoko, D. and Permadi, D. : Development of Spatial Database System Based on Cloud Computing Remote Sensing for Monitoring of Oil Palm Plantation in Indonesia, International Journal of Geoinformatics, 20(11), pp.39–53 (2024), doi: 10.52939/ijg.v20i11.3683

Supriyanto
debasupriyanto@apps.ipb.ac.id
He was a lecturer in the Mechanical and Biosystem Engineering Department, Faculty of Agriculture, Engineering Technology, IPB University, Indonesia. His research focused on innovative agriculture applications, including drone technology, the Internet of Things, and artificial intelligence.

Aldika Nugraha
He was a master's student in the Agriculture and Biosystem Engineering Study Program at IPB University, Indonesia. His research interest is in applications for innovative plantation drones.
Cecep Ijang Wahyudin
He was a lecturer and researcher at Plantation Technology Pelalawan, Riau focusing his research on palm oil plantation agronomy and cultivation management. He was graduated Ph.D in Agronomy from IPB University and has extensive experience on oil palm plantation.

Aqwam Muhammad Hanisa
He graduated from IPB University in the Agriculture and Biosystem Engineering Study Program, Faculty of Agriculture, Engineering and Technology, Indonesia. His research interest is in drone and smart farming technologies.

Mohamad Solahudin
He was an academic researcher specializing in agricultural engineering and sustainable farming systems. His work focused on developing innovative approaches to improving agricultural productivity while maintaining environmental balance.

Lilis Sucahyo
He is a dedicated researcher and academic with expertise in sustainable agriculture, environmental management, and rural development. Her scholarly interests focus on integrating modern agricultural technologies with local wisdom to improve food security and community resilience.
Sudradjat
He is a lecturer and researcher at IPB University, specializing in palm oil agronomists, industries and business. His research interests include tree physiology, plantation management, and the development of environmentally friendly practices to support forest conservation and productivity.
採録決定:2025年10月30日
編集担当:石井一夫(公立諏訪東京理科大学)