WISDOM-DX: An Automatic DX Assessment System Using a QA System Based on Web Data
1. Introduction
In recent years, a growing number of entrants have been appearing and deploying cutting-edge business models using data and digital technologies as game-changers that cause new global trends. Among these trends, digital transformation (DX) is becoming a must for Japanese companies to cope with a compound problem called “Japan's 2025 Digital Cliff” caused by antiquated systems and a shortage of human resources in IT. To promote their DX initiatives, Japan's Ministry of Economy, Trade and Industry (METI) formulated DX Promotion Indices [1] as well as the Digital Governance Code [2], the DX Certification System [3], and the selection of DX Stocks [4].
The DX Promotion Indices is a tool for companies to share awareness of current situations and challenges with regard to their DX efforts among their business stakeholders and guide themselves to future actions. The DX Promotion Indices consists of quantitative and qualitative indices to assess both management for promoting DX and IT systems in achieving DX. METI has been encouraging companies to submit the results of their self-assessments to a neutral organization, the Information-technology Promotion Agency (IPA).
Despite the efforts by METI, the results of self-diagnosis based on the DX Promotion Indices in 2020 showed that 95% of companies are not working on DX at all or are only in the beginning stage of working on it. This result suggests that most companies cannot establish either self-assessment or policy improvement in their DX promotion [5]. DX assessments by private consulting firms are also not contributing to those companies, because of their high expense. In the end, the majority are in the middle of improving their awareness of DX. Therefore, we believe that an easy and affordable new assessment measure is necessary.
In this paper, we propose an automatic assessment system named WISDOM-DX that extracts activity information of companies related to DX Promotion Indices from information published on the Web and generates a ranking of companies from a given company list. We demonstrate the reliability and usefulness of the proposed system by comparing it with assessment results by DX experts. Lastly, we will discuss our plan to provide our automatic assessment system WISDOM-DX as an open platform in the future.
2. Related Works
2.1 Manual Surveys on DX in Japan
A number of organizations such as private research companies [6]-[8], industry associations [9]-[11], local governments [12], [13], and government agencies [4], [14]-[16] have conducted surveys to analyze the progress of DX and to review the adoption of grant projects. The surveys have targeted private and public institutions. They are generally evaluated by experts who analyze the results of questionnaires, interviews, and proposals. Regarding questionnaires, both selective questions and open-ended questions are used. The selective questions are suitable for quantitative analysis, while the open-ended questions are suitable for collecting respondents' unexpected opinions and thoughts.
In the case of the DX Stocks selected by METI and the Tokyo Stock Exchange (TSE), the examination committee selects outstanding companies according to the results of questionnaires using both selective and open-ended questions [4]. The companies selected as DX Stocks are those that have been recognized as outstanding not only for introducing IT systems and utilization of data, but also for continuing to take on the challenge of reforming business models and management with the help of digital technology. In 2015, METI and the TSE started the Competitive IT Strategy Company Stocks Selection program to promote strategic IT utilization in Japanese companies [4]. Since 2020, METI and the TSE have transferred the program to the DX Stocks Selection [10]. In the DX Stocks 2021, the DX Research Secretariat conducted a questionnaire survey of approximately 3,700 companies listed on the TSE. The survey covered the following six major items: (A) management vision and business model, (B) strategy, (C) use of IT systems and digital technology to implement strategy, (D) organization and scheme to implement strategy, (E) governance, and (F) sharing of results and key performance indicators.
Responses were received from 464 companies that covered 33 industry types of the TOPIX Sector Indices. In the first step, respondents were evaluated in terms of their answers to 35 selective questions and their three-year average scores for return on equity (ROE). In the second step, the examination committee, which consisted of nine experts, assessed the companies' DX initiatives by examining their answers to 38 open-ended questions. The committee's discussions resulted in the selection of the DX Stocks 2021 (28 companies, including two “Grand Prix” companies) and the Noteworthy DX Companies 2021 (20 companies) in June 2021 [4]. Among the DX Stocks 2021, one or two companies were selected for each of the 33 industry types [14]. The Noteworthy DX Companies 2021 were selected from companies that were not selected among the DX Stocks 2021 but had noteworthy initiatives in the area of corporate value contribution [14]. Although the overall ranking of the selected companies has not been disclosed, the Grand Prix, DX Stocks, and Noteworthy DX Companies were highly evaluated, in that order. Note that, from 2015 to 2019, METI and the TSE also selected Grand Prix companies and Noteworthy IT Strategy Companies, before transitioning to the selection of Noteworthy DX Companies in 2020. All the names and initiatives of the selected companies are published on the Web via stock selection reports [4]. The response rate of the questionnaires was between 6% and 15% [15].
2.2 Question-Answering System
Question-answering (QA) systems have been studied as a means of automatically generating answers to questions [17]-[19]. Because the answering capability depends on the quality and quantity of the available data, there is an issue of how to obtain and update the data. Web information and Wikipedia have been proposed as knowledge sources [20]-[22]. Large-scale data has been used for answering open questions, and QA techniques have been developed in an international shared task [19]. Task design is a critical issue for practical use because it is not possible to answer all questions completely. WISDOM X is a QA system that uses data from approximately six billion Web pages to answer the following types of questions [22]: the factoid-type, how-type, why-type [23], what-happens-if-type [24], and definition-type. WISDOM X is designed to provide a wide range of pinpoint answers, such as a noun phrase for a fact question or a sentence for a what-happens-if question. This feature constitutes a major difference from commercial search engines, which merely provide Web pages in response to a given question and rely on human effort to ascertain pinpoint answers. WISDOM X has been available since 2015. In March 2021, we improved it by incorporating the BERT model pre-trained on 350 GB of text and applying our proprietary technique that combines BERT with a deep learning technique called adversarial learning [24]-[27]. This improvement resulted in greater accuracy and increased the variety of questions that can be answered. WISDOM X can be licensed for use in system development or database construction with the permission of NICT.
3. WISDOM-DX
3.1 Outline of WISDOM-DX
Excellent DX companies generally make effective use of the Internet and other digital technologies in their business, and their DX initiatives and evaluations are often reported on the Web. In addition to METI's report on the companies selected for DX Stocks [4], various media and research organizations have published excellent corporate initiatives on the Web [28]-[30]. Companies that are active in DX disseminate a lot of information on the Web through public relations, investor relations, and other promotional activities. This includes information such as the direction of corporate management and the use of IT technologies, specific strategies, systems to promote those strategies, measures to improve the business environment, and the status of strategies. There are two types of DX promotion initiatives: those related to corporate management, such as top-management commitment, presentation of management strategy and vision, and organizational development [31]; and those related to IT technologies such as the cloud, the Internet of Things (IoT), big data, and AI [32]. By using such Web data on corporate management and IT technologies, we have developed a system, called WISDOM-DX, to automatically perform surveys that are currently conducted manually [33].
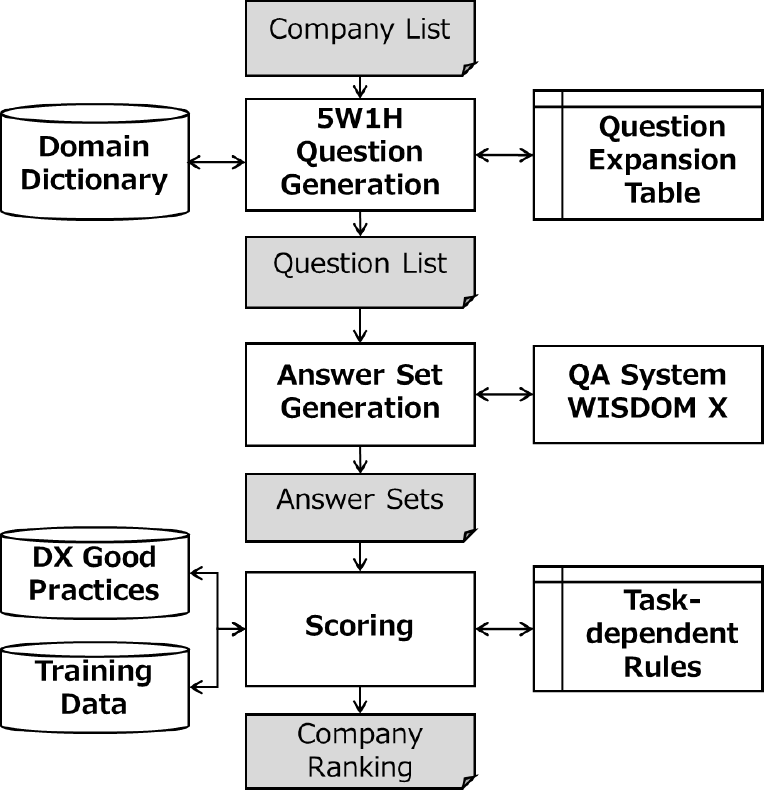
Figure 1 shows the system configuration of WISDOM-DX. By composing expressions from a question expansion table and a domain dictionary, the 5W1H question generation module produces a list of 5W1H questions about the DX initiatives of each company in an input company list. Next, the answer set generation module outputs an answer set obtained by inputting the 5W1H question list to the QA system. Finally, the scoring module evaluates the answer set from the viewpoints of the answer volume, plausibility, and similarity, and it outputs a company ranking based on DX good practices, training data, and task-dependent rules. The DX good practices consist of text data about company initiatives that have been published on the Web as good practices in the past. The training data is binary and consists of a positive or negative value for each company. Companies that have been reported to have excellent DX initiatives are recorded as positive, while other companies are recorded as negative. Lastly, the task-dependent rules are constraints or conditions that evaluators should consider in addition to the content of initiatives. For example, in the case of DX Stocks 2021, a maximum of one or two companies were selected for each of the 33 industry types to avoid bias toward any particular industry [14]. The task-dependent rules control the final ranking by giving higher priority to the top-level companies in a particular industry.
3.2 5W1H Question Generation
WISDOM-DX generates generic, exhaustive 5W1H questions in accordance with DX assessment items. The question expansion table describes slotted question sentences by using the slot markers <sub>, <obj>, and <pred>. We define six question types corresponding to 5W1H and prepare slotted question sentences for each question type as follows:
- ・Question Type 1: “How did <sub> <pred> <obj>?”
- ・Question Type 2: “Where did <sub> <pred> <obj>?”
- ・Question Type 3: “Who <pred> <obj> in <sub>?”
- ・Question Type 4: “What did <sub> <pred> for <obj>?”
- ・Question Type 5: “Why did <sub> <pred> <obj>?”
- ・Question Type 6: “When did <sub> <pred> <obj>?”
Specific expressions for the <obj> slots and <pred> slots are stored in the domain dictionary, separately by question type. In the case of Question Type 1, “digital transformation” and “DX” are stored as expressions for slot <obj>, and “conduct,” “achieve,” and “start” are stored for slot <pred>. The dictionary also stores company names including aliases, linked with company IDs. When a company ID is input to the system, company names corresponding to the ID are looked up and filled in the <sub> slot. As a result, multiple sets of 5W1H questions are generated by combining the slotted question sentences and specific expressions. In the previous case of Question Type 1, when a company ID of “Company A” is input, WISDOM-DX generates the following six types of questions: “How did Company A conduct digital transformation?”, “How did Company A conduct DX?”, “How did Company A achieve digital transformation?”, “How did Company A achieve DX?”, “How did Company A start digital transformation?”, and “How did Company A start DX?”.
3.3 Answer Set Generation
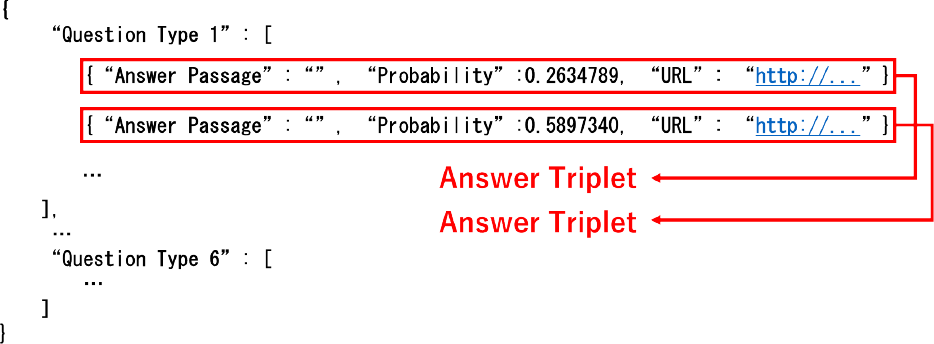
The answer set generation module sends generated question sentences as queries to the QA system. Figure 2 shows the model of the QA system for WISDOM X. After embedding the questions and passages obtained from Web data, WISDOM X inputs them to adversarial networks for generating compact-answer representation (AGR). It also inputs them to a passage encoder and a question encoder, which are BERT-based representation generators. Next, it generates compact-answer representations as fake representations, as well as passage and question representations as true representations. Logistic-regression-based answer selection is then used to estimate the probability of each passage containing an answer to the question. Eventually, WISDOM X sends the answer passages with probabilities to the answer set generation module [25]. For each of the 5W1H question types, the answer set generation module composes an answer triplet consisting of an answer passage, plausibility, and the URL of the source Web page. Finally, all of the answer triplets obtained from each question type are merged per the same question type to eliminate duplication of answer triplets. The answer triplet is represented using answer data structure in Figure 3.
![: QA model of WISDOM X. (Excerpt from Figure 1(a) of Reference [25])](TR0403-B-04/image/4-3-2-2.png)
3.4 Scoring
WISDOM-DX scores a company's DX initiatives in terms of the answer sets and DX good practices from the following viewpoints: answer volume, answer plausibility, and similarity to DX good practices. These characteristics are used to define eight score functions. We use the following notations:
- $\boldsymbol{A}$ is an answer set obtained by the QA system for a question.
- $a$ is an answer triplet, and an element of $\boldsymbol{A}$.
- $p\left( a \right)$ is the plausibility of $a$.
- $\boldsymbol{w}\left( a \right)$ is a set of words in the answer passage of $a$.
- $d$ is text data of DX good practices.
- $\boldsymbol{w}\left( d \right)$ is a set of words in the text data $d$.
- $\boldsymbol{v}\left( w \right)$ is a word embedding vector of a word $w$.
- $idf \ \left( w \right)$ is an inverse document frequency of a word $w$.
- $tf \ \left( w \right)$ is the term frequency of a word $w$.
- $sim \ \left( {w,d} \right)$ is the similarity between a word $w$ and text data $d$ defined as:\[sim\left( {w,d} \right) = \mathop {\max }\limits_{w' \in \boldsymbol{w}\left( d \right)} \frac{{\boldsymbol{v}\left( w \right) \cdot \boldsymbol{v}\left( {w'} \right)}}{{\left\| {\boldsymbol{v}\left( w \right)} \right\|\left\| {\boldsymbol{v}\left( {w'} \right)} \right\|}}\],where a set of words in the text are obtained by morphological analysis with the natural language processing library spaCy [34], and “ja_core_news_lg,” which is a Japanese language model for spaCy that is derived from UD Japanese GSD [35]. The number of words in this model is 480,000, and the vectors are 300-dimensional.
1) Score Functions
We introduce multiple score functions for the answer set $\boldsymbol{A}$ in the following:
- Score function cnt (count of the answer volume):\[Score\left( \boldsymbol{A} \right) = \sum\nolimits_{a \in \boldsymbol{A}} 1 \].
- Score function sim (combination of the similarity and cnt):\[Score\left( {\boldsymbol{A},d} \right) = \sum\nolimits_{a \in \boldsymbol{A}} {} \sum\nolimits_{w \in \boldsymbol{w}\left( a \right)} {} sim\left( {w,d} \right)\].
- Score function sim-idf (combination of the inverse document frequency and sim):\[Score\left( {\boldsymbol{A},d} \right) = \sum\nolimits_{a \in \boldsymbol{A}} {} \sum\nolimits_{w \in \boldsymbol{w}\left( a \right)} {} sim\left( {w,d} \right) \cdot idf\left( w \right)\].
- Score function sim-tf-idf (combination of the term frequency and sim-idf):\[Score\left( {\boldsymbol{A},d} \right) = {}\sum\nolimits_{a \in \boldsymbol{A}} \sum\nolimits_{w \in \boldsymbol{w}\left( a \right)} sim\left( {w,d} \right) \cdot tf\left( w \right) \cdot idf\left( w \right)\].
- Score function cnt-p (combination of the plausibility and cnt):\[Score\left( \boldsymbol{A} \right) = \sum\nolimits_{a \in \boldsymbol{A}} p \left( a \right)\].
- Score function sim-p (combination of the plausibility and sim):\[Score\left( {\boldsymbol{A},d} \right) = \sum\nolimits_{a \in \boldsymbol{A}} {} \sum\nolimits_{w \in \boldsymbol{w}\left( a \right)} {} sim\left( {w,d} \right) \cdot p\left( a \right)\].
- Score function sim-idf-p (combination of the inverse document frequency and sim-p):\[Score\left( {\boldsymbol{A},d} \right) = \sum\nolimits_{a \in \boldsymbol{A}} \sum\nolimits_{w \in \boldsymbol{w}\left( a \right)} sim\left( {w,d} \right) \cdot idf\left( w \right) \cdot p\left( a \right)\].
- Score function sim-tf-idf-p (combination of the term frequency and sim-idf-p):\[Score \left( {\boldsymbol{A},d} \right) = \sum\nolimits_{a \in \boldsymbol{A}} \sum\nolimits_{w \in \boldsymbol{w}\left( a \right)} sim \left( {w,d} \right) \cdot tf \left( w \right) \cdot idf \left( w \right) \cdot p \left( a \right)\].
In summary, WISDOM-DX scores an answer set $\boldsymbol{A}$ using these eight functions.
2) Multi Question Score Ensemble
As described in Section 3.3, WISDOM-DX generates an answer set for each of the six question types. Eight score functions are then applied to the six answer sets, which results in obtaining 48 ($6 \times 8$) scores. Therefore, it is necessary to integrate the 48 scores to obtain one combined ranking for input companies. As an unsupervised integration method, reciprocal rank fusion (RRF) has been proposed. RRF uses reciprocal ranking with a constant correction term. RRF has been reported to perform better than the Condorcet integration method and other learning-based methods for integrating multiple relevant document rankings [36] in the NIST TREC document retrieval task [37]. However, in our case, the accuracy of the 48 scores may vary greatly depending on the obtained answer sets for each question type. Weighted averaging is known to be robust in such cases [38]. From these considerations, we developed the multi-question score ensemble (MQSE), which is an extended version of RRF that incorporates coupling parameters to obtain one combined ranking from multiple rankings generated from six question types and eight score functions. MQSE searches for optimal coupling parameters that maximize an objective function. The past DX Stocks or Competitive IT Strategy Company Stocks can be used as training data for MQSE, where the label is 1 for awarded companies as DX Stocks or Noteworthy companies, and 0 for the others.
As for objective functions, we use the area under the precision-recall curve (AUPR). This is because, first, the area under the curves (AUCs) including AUPR are good metrics to measure the accuracy across ranking from top to bottom; second, training data is imbalanced data with 10 times more negative cases; and third, AUPR is more sensitive to the true positives at the top of the ranking than other AUCs such as AUROC. The coupling parameters of MQSE are optimized by direct optimization of the final objective index AUPR. Specifically, we use the following procedure to estimate the coupling coefficients:
Step 1: The values of the eight score functions are obtained for the answer set ${\boldsymbol{A}_t}$ for six question types for each company.
Step 2: The scores obtained in Step 1 for each company are separated for each combination of question type and score function. The scores are then sorted in descending order to obtain a company ranking: $R\left( {Scor{e_s}\left( {{\boldsymbol{A}_t}} \right)} \right)$.
Step 3: The overall score $Scor{e_{MQSE}}$ is obtained from all the combinations of six question types and eight score functions $Scor{e_s}\left( {{\boldsymbol{A}_t}} \right)$ in the answer set $\boldsymbol{A}$ using the following formula:\[Scor{e_{MQSE}}\left( \boldsymbol{A} \right) = \sum\nolimits_{\left\{ {s,t} \right\}} {} \frac{{\widehat {{c_{s,t}}}}}{{R\left( {Scor{e_s}\left( {{\boldsymbol{A}_t}} \right)} \right)}}\],where $\{ s \}$ consists of the eight score functions, $\{ t \}$ consists of the six question types, and $\widehat {c_{s,t}}$ represents the coupling coefficients.
Step 4: The coupling coefficients are directly optimized by using the AUPR as the objective function as:\[\widehat {{c_{s,t}}} = \mathop {{\mathrm{argmax}}}\limits_{{c_{s,t}}} AUPR\left( {Scor{e_{MQSE}}\left( \boldsymbol{A} \right),{y_{true}}} \right)\],where ${y_{true}}$ denotes the labels for binary classification in training data. We use the companies selected as DX Stocks, Competitive IT Strategy Company Stocks, Noteworthy DX Companies, or Noteworthy IT Strategy Companies from 2015 to 2020 as training data. The coupling coefficients are estimated by grid search with positive labels for selected companies and negative labels for unselected companies. In addition, $AUPR\left( {Scor{e_{MQSE}}\left( \boldsymbol{A} \right),{y_{true}}} \right)$ is the AUPR of a precision-recall curve obtained by using the ranking results of the score function $Scor{e_{MQSE}}\left( {{\boldsymbol{A}_t}} \right)$ and the labels ${y_{true}}$.
Although SVM-perf [39] is a direct AUC optimization algorithm and could be a specific method of estimating the $\widehat {c_{s,t}}$, it cannot be applied to optimize the MQSE coupling coefficients. The problem is that the algorithm is based on a loss that is related to pairwise replacement of two elements, which is not compatible with MQSE. Hence, we introduce an optimization algorithm that combines grid search and iterative methods to estimate the $\widehat {{c_{s,t}}}$ in MQSE.
To reduce the computational cost of grid search, we assume an approximate product relation ${c_{s,t}} = {\alpha_s}{\beta_t}$. Then, instead of estimating the $\widehat {{c_{s,t}}}$, we optimize the coupling coefficients ${\alpha_s}$ of the score function and ${\beta_t}$ of the question type asymptotically for ${c_{s,t}}$ with an iterative method. Specifically, the coupling coefficients ${\widehat {{\alpha_s}}^{\left( l \right)}}$ and ${\widehat {{\beta_t}}^{\left( l \right)}}$ are calculated in an alternating iterative way for $l = 1, \cdots $ by the following asymptotic equations:\[{\widehat {{\alpha_s}}^{\left( l \right)}} = \mathop {{\mathrm{argmax}}}\limits_{{\alpha_s}} AUPR\left( {\mathop \sum\nolimits_{\{ s,t\}} \frac{{{\alpha_s}{{\widehat {{\beta_t}}}^{\left( {l - 1} \right)}}}}{{R\left( {Scor{e_s}\left( {{\boldsymbol{A}_t}} \right)} \right)}},{y_{true}}} \right)\],\[{\widehat {{\beta_t}}^{\left( l \right)}} = \mathop {{\mathrm{argmax}}}\limits_{{\beta_t}} AUPR\left( {\mathop \sum\nolimits_{\{s,t \}} \frac{{{{\widehat {{\alpha_s}}}^{\left( l \right)}}{\beta_t}}}{{R\left( {Scor{e_s}\left( {{\boldsymbol{A}_t}} \right)} \right)}},{y_{true}}} \right)\].
Finally, the optimized score is calculated using ${\widehat {{\alpha_s}}^{\left( l \right)}}$ and ${\widehat {{\beta_t}}^{\left( l \right)}}$ :\[Scor{e_{MQSE}}^{\left( l \right)}\left( \boldsymbol{A} \right) = \mathop \sum\nolimits_{\{s,t\}} \frac{{{{\widehat {{\alpha_s}}}^{\left( l \right)}}{{\widehat {{\beta_t}}}^{\left( l \right)}}}}{{R\left( {Scor{e_s}\left( {{\boldsymbol{A}_t}} \right)} \right)}}\],were ${\widehat {{\beta_t}}^{\left( 0 \right)}}$ is a vector with all elements being 1.
3.5 Task-dependent Rules
In the training and evaluation process of MQSE, WISDOM-DX applies task-dependent rules that give priority to the companies with the highest rankings in each industry segment. Specifically, the task-dependent rules can be applied by replacing the company ranking $R\left( {Scor{e_s}\left( {{\boldsymbol{A}_t}} \right)} \right)$ with $R( {Scor{e_s}( {{\boldsymbol{A}_t}} )} ) + cost( {{r_{seg}}})$ in the asymptotic equations and optimized score in Section 3.4. Here, ${r_{seg}}$ is a ranking in the industry segment, and $cost\left( {{r_{seg}}} \right)$ is a cost function defined as the following hinge function:\[cost\left( {{r_{seg}}} \right) = \left\{ {\begin{array}{*{20}{c}}{a \cdot N\left( {{r_{seg}} - {n_{max}}} \right)}&{\left( {{r_{seg}} > {n_{max}}} \right)}\\0&{\left( {{r_{seg}} \le {n_{max}}} \right)}\end{array}} \right.\],where ${r_{seg}}$ is a rank in the segment, $N$ is the total number of the companies, and ${n_{max}}$ and $a$ are parameters of the cost function.
4. Experiments
4.1 Purpose
We assume that the primary users of WISDOM-DX is DX promotion staffs at companies who are assessing and planning their company's DX promotion activities and strategies. WISDOM-DX provides those users with a ranking of companies' DX promotion with a list of relevant snippets and URLs for each company. DX promotion staffs can utilize the ranking to evaluate their progress in DX promotion. The ranking is useful for users to identify role models. A list of relevant snippets and URLs is convenient for studying DX use cases of those role models.
Finding role models for users' companies bring great benefit to their planning of DX promotion plans and strategies. They can learn and imitate best practices of their role models. One such example of best practice we found from WISDOM-DX's output is a case of human resource development for DX promotion at a pharmaceutical company. In this case, the company transferred their DX promotion staffs to a foreign IT consulting farm, and their staffs experienced various projects on digitization of customer's business processes for a couple of years. After returning from the IT consulting farm, their stuffs confidently made various proposals, and the company's DX promotion began to progress rapidly. We can find a number of such cases from WISDOM-DX's output. Therefore, the users can find most feasible best practices depending on their companies' circumstances.
Based on the above use case of WISDOM-DX, we conduct evaluation experiments to verify whether the quality of the assessment by WISDOM-DX is of a practical level. For this purpose, we evaluate the quality of the company rankings by WISDOM-DX in multiple evaluation tasks. We will focus on verifying the following points in the experiments.
1) Feasibility of Using Web Data
We could not find any relevant study that is supporting our idea of utilizing Web information to survey companies' DX promotion activities. Therefore, it is necessary to introduce a baseline method to ascertain the validity of the idea. In the context of detecting influenza epidemics, both query-log based approach [40] and relevant message based approach [41] are known to be effective. The query-log based approach (e.g. Google Trends) is applicable to macroscopic trend analysis of DX [42]. However, it is not appropriate for the trend analysis of companies' DX promotion, because such specific queries are very rare in query-log. On the other hand, the relevant message based approach (e.g. Google Custom Search) is promising if we use relevant Web documents, instead of relevant SNS messages, because the Web is a well-established medium for publishing a variety of company related information.
2) Effectiveness of Using QA System and MQSE
We validate the effectiveness of using the QA system WISDOM X with 5W1H questions by comparing it with the baseline method. The effectiveness of the proposed ensemble method MQSE is also validated in the evaluation.
3) Validity of WISDOM-DX's Ranking
We evaluate the validity of WISDOM-DX's ranking by comparing it with DX experts' evaluations as gold standards in the evaluation task. In addition, we examine the validity of WISDOM-DX's ranking by analyzing its top-ranked companies individually to cover the limitation of evaluation depending solely on DX experts' evaluation for a limited number of companies.
4) Subjective Evaluation by Users
We survey companies' opinions on the agreeability and usefulness of assessment results obtained by WISDOM-DX. The assessment result consists of their ranking in the same industry and the URL list obtained by WISDOM-DX.
4.2 Evaluation Methods
In accordance with the purpose described in the previous subsection, we will conduct evaluations of the following measures.
1) End-to-end Evaluation Task
We introduce a test set consisting of 464 companies that responded to the DX Stocks 2021 survey, and define a binary classification task and a ranking task for the test set. As described in Section 2.1, the DX Stocks 2021 survey resulted in the selection of 48 companies (hereinafter, the 48 companies are called the “DX2021-selected companies”). The DX2021-selected companies are treated as positives and others are negatives in the answer of the binary classification task. The number of positives in companies in the answer, 48, will be given as constraint of the classification task.
2) Baseline Methods
We introduce two baseline methods to compare their performance with the proposed method. The first method ranks companies in the order of their number of search results by Google Custom Search. We use the following string as the search query for each company: company name AND “digital transformation”.
The second method solely relies on the labels in the training data. Specifically, the following score function is used for the ranking:\[Scor{e_{prize}}\left( x \right) = {f_{Prize}}\left( x \right) + \varepsilon \],where $x$ is a target company, ${f_{Prize}}\left( x \right)$ is a binary function of $x$, taking 1 if $x$ received any of DX Stocks, Competitive IT Strategy Company Stocks, Noteworthy DX Companies, or Noteworthy IT Strategy Companies in 2015–2020, and 0 otherwise. Here, $\varepsilon $ is a uniformly distributed random number that satisfies $0 \le \varepsilon < 1$.
3) Evaluation Metrics
We use two evaluation metrics for the binary classification task and ranking task, respectively. We use precision and AUPR for the binary classification task and the ranking task, respectively. Note that precision and recall in the binary classification task are equal because of the constraint on the number of positives. Comparing the binary classification task and the ranking task, the former focuses on the accuracy of predicting the DX2021-selected companies, and the latter on the quality of rankings across the entire range.
4) Extension of Correct Answer Data
To enhance the evaluation based on the limited number of DX2021-selected companies, we also consider DX certifications by METI and the DX-related award-winning history of the company other than the DX Stocks 2021 in the binary classification task. The DX-related awards include DX certifications by METI and other DX-related awards from media or industry organizations.
5) Identifying Potential Risk of Overfitting
The end-to-end evaluation task using common 464 companies for both training data and test data has a potential risk of overfitting due to an overlap of award-winning companies in test data (in 2021) and training data (in 2015–2020). To verify the potential risk of overfitting, we create a set of additional evaluation datasets considering the overlap of positive companies in test and training data. To obtain the evaluation sets, we divide the 464 companies used for end-to-end evaluation into 4 equal subsets including the 48 award-winning companies in 2021, and assign two subsets each to test and training data so that two company sets of test and training data are “disjoint” or “equal”. As a result of the combination (${}_4^{}C_2^{} = 6$), we obtain six “disjoint” evaluation sets and six “equal” evaluation sets.
6) Subjective Evaluation by Users
To evaluate the agreeability, usefulness, and requested functions of WISDOM-DX from the user's perspective, we carry out an opinion survey of the respondents using a questionnaire comprising the following questions:
Q1: Do you think WISDOM-DX's ranking of your company within the industry is agreeable?
Q2: Do you think WISDOM-DX is useful as an in-house analysis tool?
Q3: Please describe how you would like to use WISDOM-DX as an in-house analysis tool, and what functions you would like to have for the purpose.
Q1 and Q2 above are multiple-choice questions with the five level options “Yes,” “Somewhat yes,” “Neither yes nor no,” “Somewhat no,” and “No,” and comment sections for the choices. The last question is open-ended.
7) DX Good Practices and Training Data
The DX good practices is text data introducing case studies of DX initiatives and the training data is a list of 255 awarded companies. Both of them were extracted from METI's reports on DX Stocks, Competitive IT Strategy Company Stocks, Noteworthy DX Companies, and Noteworthy IT Strategy Companies, published from 2015 to 2020 [4]. The training data consists of 255 positive companies only, because the responding companies in those surveys are not available in our experiment. Therefore, we complimentarily use companies in the test set other than the positive 255 companies as negative companies in the training process.
8) Task-dependent Rules
We use the task-dependent rules described in Section 3.5 with the hinge function parameters $N = 464$, ${n_{max}} = 3$, and $a = 0.5$. The values ${n_{max}} = 3$ and $a = 0.5$ are determined to maximize the AUPR for the training data. Note again that this rule was designed to prevent companies in a small number of industries from dominating the top rankings.
4.3 Results of Binary Classification Task
Table 1 shows the number of DX2021-selected companies in 48 positive companies by WISDOM-DX with MQSE (“MQSE” in the table) and the baseline methods (“Prize” and “Google” in the table). Regarding the 48 companies obtained by MQSE, 27 companies are DX2021-selected companies (true positives), while the other 21 companies are not (false positives). As for the Prize and Google, 22 and 11 companies are DX2021-selected companies (true positives), while the other 26 and 37 companies are not (false positives), respectively. From these results, the precision of the binary classification results by MQSE, Prize, and Google are calculated as 56.3%, 45.8%, and 22.9%, respectively.
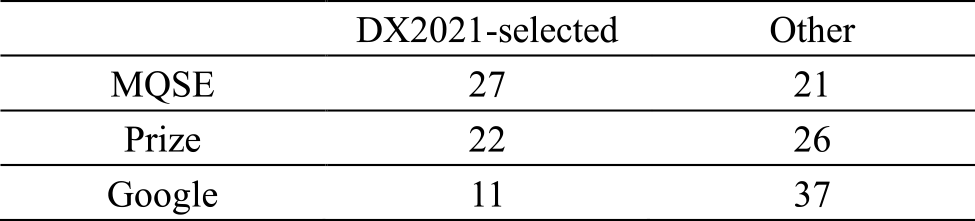
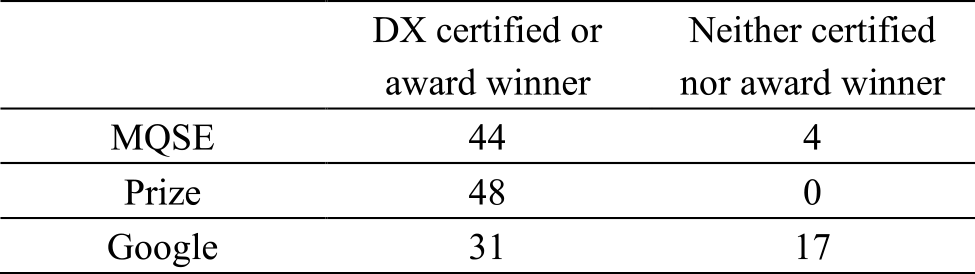
Table 2 shows the number of DX certified or DX-related award winners including the DX2021-selected companies in the 48 positive companies by WISDOM-DX (“MQSE” in the table) and the baseline methods (“Prize” and “Google” in the table). Regarding the 48 positive companies obtained by MQSE, 44 (91.7%) companies are DX certified or award winners including 27 DX2021-selected companies, while the other four companies are neither certified nor award winners. As for Prize and Google, 48 (100.0%) and 31 (64.6%) companies are DX certified or award winners including 22 and 11 DX2021-selected companies, while the other 0 and 17 companies are neither certified nor award winners, respectively. Note that the value 48 (100.0%) of Prize is inevitable, because Prize always selects positives from award-winning companies in the training data.
4.4 Results of Ranking Task
Figure 4 shows the precision-recall curves of the rankings obtained by WISDOM-DX with MQSE (“MQSE” in the figure) and the baseline methods (“Prize” and “Google” in the figure). WISDOM-DX with MQSE integrates 48 rankings obtained by using all possible combinations of eight score functions and six question types corresponding to 5W1H described in Section 3.2 and 3.4. The AUPR values of the rankings by MQSE, Prize, and Google are 0.540, 0.359, and 0.181, respectively.
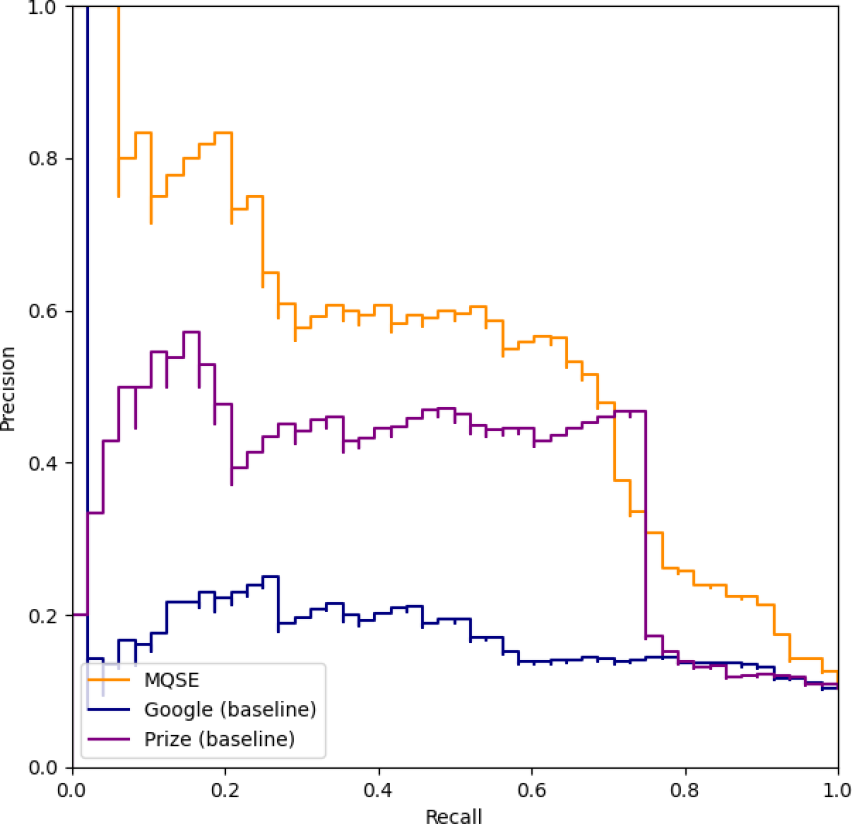
Table 3 shows the AUPR values for the rankings obtained by WISDOM-DX with and without MQSE. The AUPR value of MQSE 0.540 coincides with the AUPR value of MQSE in Figure 4. The matrix of “Score Functions” and “Question Types” in the figure shows the AUPR values of 48 rankings obtained by WISDOM-DX without using MQSE. The results show that all AUPR values of 48 rankings obtained by WISDOM-DX with six question sentences and eight score functions, ranged from 0.303 to 0.434, with an average of 0.391.
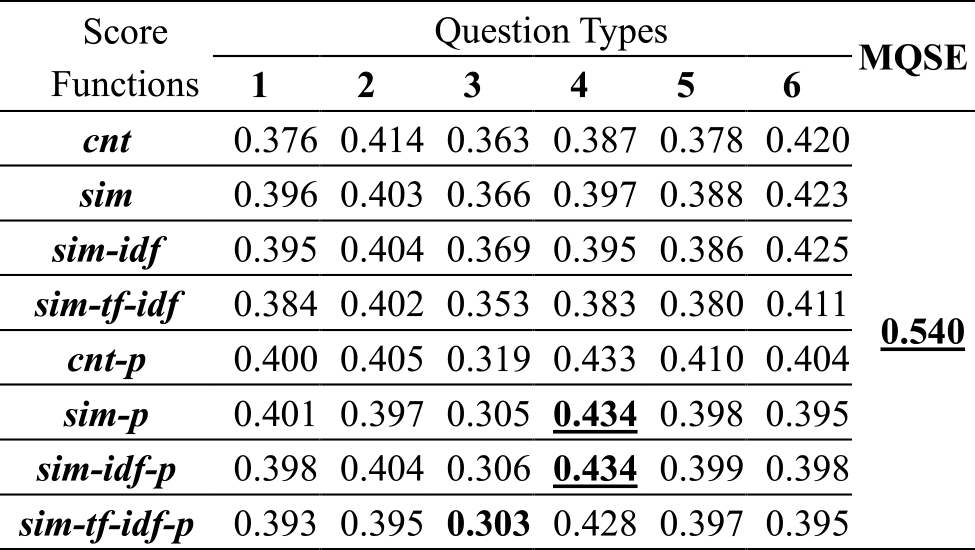
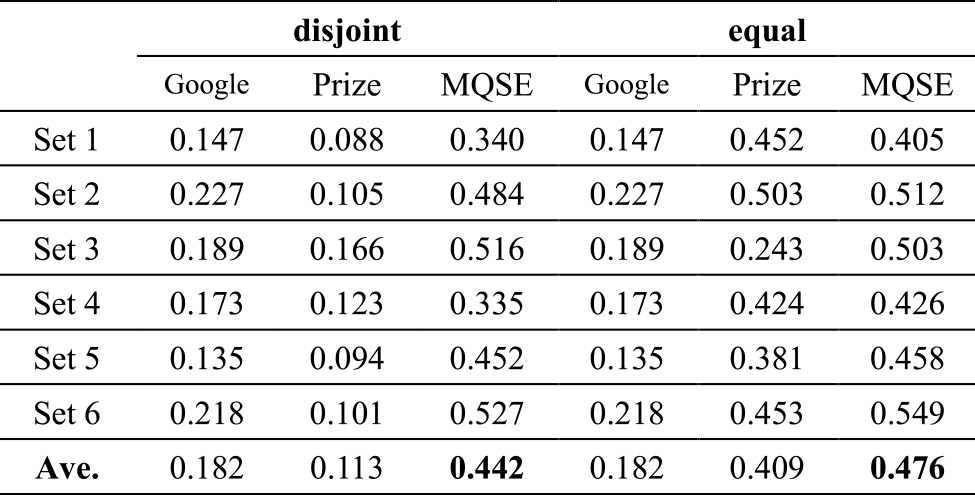
Table 4 shows the AUPR values for the rankings obtained by WISDOM-DX with MQSE, Prize, and Google on six “disjoint” evaluation sets (“disjoint” in the table) and six “equal” evaluation sets (“equal” in the table), respectively. The average of AUPR values of MQSE, Prize, and Google on “disjoint” sets were 0.442, 0.113, and 0.182, respectively. In contrast, the average values of AUPR of MQSE, Prize, and Google on “equal” sets were 0.476, 0.409, and 0.182, respectively.
4.5 Results of Subjective Evaluation by Users
We conducted an opinion survey of 28 companies covering 15 of the 33 industry types of the TOPIX Sector Indices using the set of questions defined in Section 4.2. Table 5 shows the rates of answer options selected for Q1 and Q2. The rate of positive, neutral, and negative respondents to the questions were 60.7%, 32.1%, and 7.1% for Q1, and 46.4%, 39.3%, and 14.3% for Q2, respectively.
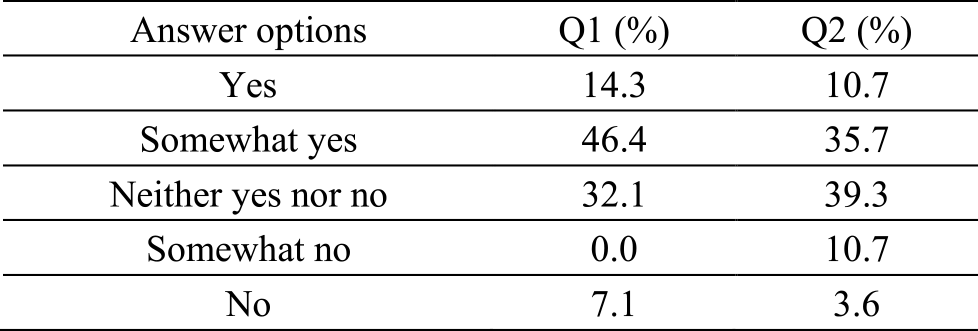
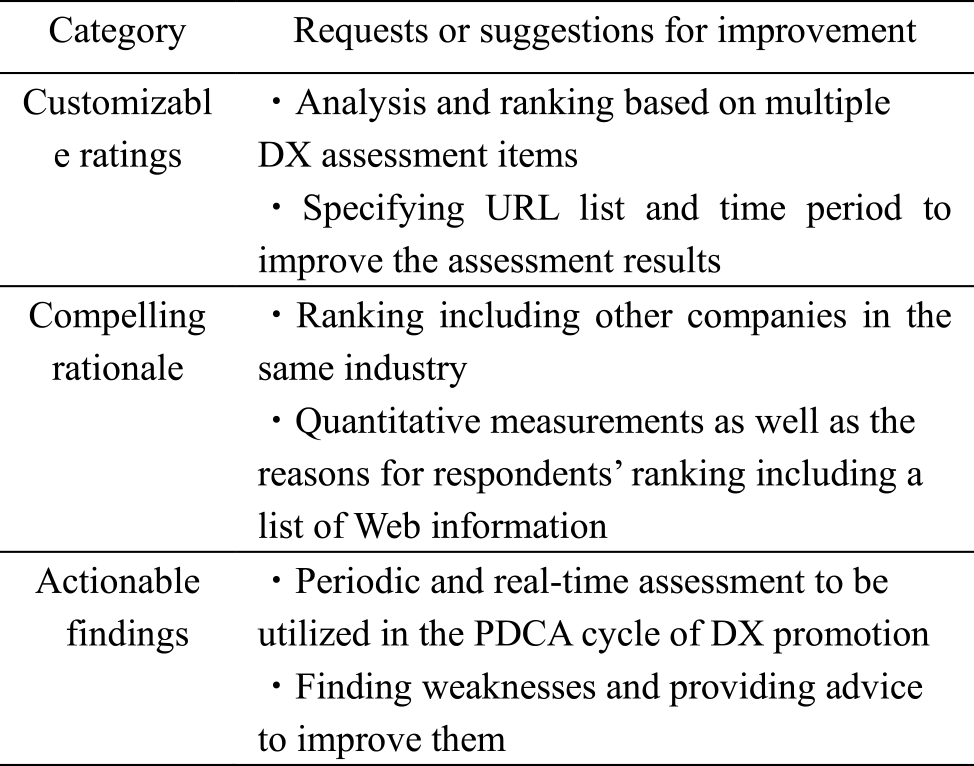
Table 6 shows the majority of requested functions answered in response to Q3. These opinions fall into three broad categories: “customizable ratings,” “compelling rationale,” and “actionable findings.”
5. Discussion
In this section, we discuss the obtained experimental results for the four points given in Section 4.1.
1) Feasibility of Using Web Data
To observe the feasibility of using Web data, we introduced a simple baseline method that ranks companies in the order of their number of search results with Google Custom Search. According to the results of the binary classification task, the precision value of WISDOM-DX with MQSE, Prize, and Google were 56.3%, 45.8%, and 22.9%, respectively, and the rate of companies that had received DX-related awards or certifications in positive companies generated by WISDOM-DX with MQSE, Prize, and Google were 91.7%, 79.2%, and 64.6%, respectively. Considering that the expected precision by random selection is 10.3%, the effectiveness of utilizing Web data for automated assessment is clear. From the results, we can conclude that Web data contains information on companies' DX activities and utilizing Web data for automated assessment is a promising approach, as was expected.
2) Effectiveness of Using a QA System and MQSE
The aim of using a QA system is to extract only information related to companies' DX promotion from noisy Web data. To observe the feasibility of using a QA system, we compared the results of rankings obtained by WISDOM-DX without MQSE and the baseline method. Experimental results in Section 4.4 show that all AUPR values of 48 rankings obtained by WISDOM-DX using six question sentences and eight score functions range from 0.303 to 0.434, which always exceed the AUPR value 0.181 of Google baseline. This result shows the effectiveness of using the QA system.
On the other hand, automated assessment using the QA system cannot cover information about all aspects of DX assessment. Therefore, it becomes necessary to use a set of 5W1H questions and integrate the obtained information into a ranking score in a unified way using MQSE. According to the results of the ranking task, the AUPR value obtained by WISDOM-DX with MQSE is 0.540. The AUPR of WISDOM-DX with MQSE exceeds all AUPR values of 48 rankings obtained by WISDOM-DX using six question sentences and eight score functions, ranging from 0.303 to 0.434. This result shows the effectiveness of MQSE with a set of 5W1H questions.
3) Validity of WISDOM-DX's Ranking
The effectiveness of using Web data, the QA system, and MQSE have been clarified from the previous discussion. However, the precision value of 0.563 on the classification task and AUPR value of 0.540 on the ranking of 464 companies do not give a complete understanding of the actual quality of the rankings. Therefore, we investigated the false positives of MQSE, Prize, and Google in the classification task, with regard to whether they had received DX related awards including DX2021 and METI's DX certification. As a result, out of the 48 positives by MQSE, Prize, and Google, we found that 44, 48, and 31 companies had received DX related awards or METI's DX certification. Note that the value 48 of Prize is inevitable, because Prize always selects positives from award-winning companies in the training data.
If we include these DX certified or DX related award winning companies in true positives, the precision values of MQSE and Google will be 0.917 and 0.646, respectively. The precision value of MQSE 0.917 shows the effectiveness of WISDOM-DX in ranking companies that have high award potential in DX promotion.
4) Potential Risk of Overfitting
The result of end-to-end evaluation task using “equal” 464 company set for both training data and test data has a potential risk of overfitting due to the overlap of award-winning companies in test data (in 2021) and training data (in 2015–2020). To clarify this concern, we prepared “disjoint” and “equal” evaluation datasets for verification, and evaluated the averaged AUPR values of MQSE, Prize, and Google on them. The differences between the AUPR values on “equal” and “disjoint” were 0.034 (7.1% of “equal”), 0.296 (72.4% of “equal”), and 0.000 (0.0% of “equal”) for MQSE, Prize, and Google, respectively. The difference was 0.0 for Google because the score of Google baseline depends only on the search results of test data. On the contrarily, Prize baseline resulted in the largest difference 0.296 (72.4%). This is because Prize depends only on the award-winning companies in the training data and causing extreme overfitting. The difference of MQSE 0.034 (7.1%) is about one tenth of the value of Prize 0.296 (72.4%). The results show that the performance of MQSE is not significantly different between “unknown” companies in “disjoint” datasets and “known” companies in “equal” datasets. This indicates that MQSE has sufficient generalization performance and no serious overfitting is occurring with MQSE.
5) Subjective Evaluation by Users
We conducted an opinion survey of 28 companies and obtained answers of respondents regarding agreeability, usefulness, and requested functions as shown in Section 4.5.
Agreeability The rates of positive, neutral, and negative respondents were 60.7%, 32.1%, and 7.1%, respectively. The positive respondents' comments include that they understood the situation in their industry through the assessment results, while the negative respondents' comments include that the ranking algorithm was not clear to them even though the Web pages used by WISDOM-DX were presented as the evidence.
Usefulness The rates of positive, neutral, and negative respondents were 46.4%, 39.3%, and 14.3%, respectively. The positive respondents' comments include that they could identify time-series changes of their relative position from the objective viewpoints, while the negative respondents' comments include that they could not see their improvement points through their rankings and the Web pages used by WISDOM-DX.
Requested functions As shown in Section 4.5, the requested functions fall into three categories: “compelling rationale,” “customizable ratings,” and “actionable findings.” Most of these functions are essentially related to respondents' comments on agreeability and usefulness. In other words, “compelling rationale” is an issue for improving agreeability, and “customizable ratings” and “actionable findings” are issues for improving usefulness.
Overall, at least half of the users seem support the usefulness of WISDOM-DX based on the current performance and functionality, although there are requests of advanced functionality.
6. Future Issues
The improvement of agreeability and usefulness discussed in the previous section and the response to the requested functions can be addressed in the open platform of WISDOM-DX. Specific initiatives for each are described below.
1) Providing an Execution Environment
Providing the execution environment of WISDOM-DX as an analysis platform will enable users to carry out assessments by themselves. This will help users to understand the ranking algorithm of WIDSOM-DX in an interactive way, leading to improving agreeability. In addition, usefulness will be improved by providing an appropriate user interface to specify the configuration of WISDOM-DX, including the acquisition period of Web data, question templates used for question generation, the domain dictionary, score functions, task dependent rules, and parameters for MQSE. The release of a set of source code and technical documents as a development kit under a free license is also conceivable. As a result, development properties and application cases will be shared in a development community, which will enable addressing the requested functions of “customizable assessment.”
2) Linkage with Intrinsic Analysis
WISDOM-DX simplifies assessments with an extrinsic approach of collecting information on corporate DX promotion activities from Web data. However, Web data is sparse data that expresses part of the management and business activities of a company. Therefore, in order to search for improvement points underlying corporate activities, intrinsic analysis such as business strategy planning [43] using corporate data is required. By linking WISDOM-DX, an extrinsic assessment using Web data, and intrinsic factor analysis using internal company data, it will be possible to provide for actionable findings.
7. Conclusion
We developed an automatic assessment system for companies' DX promotion named WISDOM-DX. WISDOM-DX utilizes a QA system and 5W1H questions to acquire information on companies' DX-related activities from Web data. To validate the effectiveness of WISDOM-DX, we introduced two baseline systems Prize and Google. The precision value of WISDOM-DX, Prize, and Google were 56.3%, 45.8%, and 22.9%, respectively, and the rate of companies that had received DX-related awards or certifications in positive companies generated by WISDOM-DX and Google were 91.7% and 64.6%, respectively. The precision value of WISDOM-DX 91.7% shows the effectiveness of WISDOM-DX in ranking companies that have high award potential in DX promotion.
We then conducted a comparative evaluation of ranking results obtained by WISDOM-DX and Google baseline systems to prove the effectiveness of using a QA system. The AUPR of WISDOM-DX using 5W1H questions and eight score functions ranged from 0.303 to 0.434, which always exceeded the AUPR of 0.181 for the baseline system. To integrate rankings obtained by multiple questions and score functions, we proposed an ensemble method named MQSE. According to the results of a ranking task, the AUPR value obtained by WISDOM-DX with MQSE was 0.540, which exceeded all AUPR values of rankings without using MQSE. This result showed the effectiveness of MQSE.
The results of an opinion survey regarding WISDOM-DX show that 60.7% offered positive responses and 32.1% neutral responses regarding the agreeability of their rankings, and that 46.4% offered positive responses and 39.3% neutral responses regarding the usefulness of the system. These results show that WISDOM-DX has more promising performance than the baseline method, and that it offers the prospect of automating large-scale assessment regarding corporate DX initiatives using Web data. The requested functions from respondents showed that WISDOM-DX has a need for improvement in providing “compelling rationale,” “customizable ratings,” and “actionable findings.” We will address these requested functions by implementing WISDOM-DX as an open platform of analytics so that WISDOM-DX will be useful for a wider variety of companies and research organizations.
Acknowledgments We express our thanks to Mr. Hirohide Hirai, Mr. Takuya Watanabe and Mr. Ryouji Uchida of METI for their cooperation, and to Dr. Hideyuki Tokuda, Dr. Yutaka Kidawara and Dr. Kiyotaka Uchimoto of NICT for their support. We are also grateful to Mr. Yutaka Saito, Mr. Masayoshi Sakai and Mr. Gaku Moriya of IPA for their encouragement.
References
- [1] Information-technology Promotion Agency, Japan (IPA): The DX White Paper 2021, US-Japan Comparative Study on DX Strategy, Human Resources, and Technology, (2021) (in Japanese). 〈https://www.ipa.go.jp/ikc/publish/dx_hakusho.html〉
- [2] Ministry of Economy, Trade and Industry: Digital Governance Code, (2020) (in Japanese). 〈https://www.meti.go.jp/shingikai/mono_info_service/dgs5/pdf/20201109_01.pdf〉
- [3] Ministry of Economy, Trade and Industry: DX Certification System (certification system based on Article 31 of the Act on the Promotion of Information Processing). (2020) (in Japanese). 〈https://www.meti.go.jp/policy/it_policy/investment/dx-nintei/dx-nintei.html〉
- [4] Ministry of Economy, Trade and Industry: Digital Transformation Stocks (DX Stocks) 2021(2021) (in Japanese). 〈https://www.meti.go.jp/policy/it_policy/investment/keiei_meigara/dx-report2021.pdf〉
- [5] Ministry of Economy, Trade and Industry: Study Group for Acceleration of Digital Transformation WG1 Plenary Report, (2020) (in Japanese). 〈https://www.meti.go.jp/press/2020/12/20201228004/20201228004-4.pdf〉
- [6] Nikkei BP Intelligence Group: Digital Transformation II (2020) (in Japanese). 〈https://info.nikkeibp.co.jp/nxt/campaign/b/279660/〉
- [7] Yano Research Institute Ltd.: Digital Transformation (DX) Market 2020 (2020) (in Japanese). 〈https://www.yano.co.jp/press-release/show/press_id/2487〉
- [8] International Data Corporation Japan: Released the results of a survey on digital transformation trends among Japanese companies, (2020) (in Japanese). 〈https://www.idc.com/getdoc.jsp?containerId=prJPJ47071820〉
- [9] Japan Users Association of Information Systems: Enterprise IT Trends Survey 2021 (2021) (in Japanese). 〈https://juas.or.jp/library/research_rpt/it_trend/〉
- [10] Japan Information Technology Service Industry Association: Contribution of Information Service Companies to the Digital Transformation (DX) of Society (2019) (in Japanese). 〈https://www.jisa.or.jp/publication/tabid/272/pdid/30-J007/Default.aspx〉
- [11] Japan CTO Association: DX Trend Survey Report 2021 Edition, (2021) (in Japanese). 〈https://cto-a.org/news/2021/04/12/4956/〉
- [12] Tokyo Metropolitan Government: DX Promotion Pilot Project (Phase 1) (2021) (in Japanese). 〈https://www.metro.tokyo.lg.jp/tosei/hodohappyo/press/2021/03/19/05.html〉
- [13] Kanagawa Prefectural Government: Kanagawa DX Project Promotion Project (2021) (in Japanese). 〈https://www.pref.kanagawa.jp/docs/sr4/dx-project.html〉
- [14] Ministry of Economy, Trade and Industry: Video of the announcement of companies selected for Digital Transformation Stocks (DX Stocks) 2021 is now available! (2021) (in Japanese). 〈https://www.meti.go.jp/press/2021/07/20210713005/20210713005.html〉
- [15] Ministry of Economy, Trade and Industry: DX Stocks/Competitive IT Strategy Company Stocks (2021) (in Japanese). 〈https://www.meti.go.jp/policy/it_policy/investment/keiei_meigara/keiei_meigara.html〉
- [16] Ministry of Internal Affairs and Communications: Information and Communications in Japan 2021 White Paper: Present Status and Challenges for Digital Transformation in Corporate Activities (2021). 〈https://www.soumu.go.jp/johotsusintokei/whitepaper/eng/WP2021/chapter-1.pdf#page=7〉
- [17] Strzalkowski, T. and Harabagiu, S.: Advances in Open Domain Question Answering, Springer (2006).
- [18] The New York Times: Computer Wins on ‘Jeopardy!’: Trivial, It's Not (2011). 〈https://www.nytimes.com/2011/02/17/science/17jeopardy-watson.html〉
- [19] Min, S., et al.: NeurIPS 2020 EfficientQA Competition: Systems, Analyses and Lessons Learned, 2021. 〈https://colinraffel.com/publications/arxiv2021neurips.pdf〉
- [20] Mihara, E., Fujii, A. and Ishikawa, T.: A Helpdesk-oriented Question Answering System Using the World Wide Web, Proceedings of the 5th Forum on Information Technology 2005, pp.163–166 (2005) (in Japanese).
- [21] Aizawa, Y., Tsuchiya, Y. and Watabe, H.: Consideration of question answering system based on Wikipedia, Proceedings of the 18th Forum on Information Technology, pp.165–166 (2019) (in Japanese).
- [22] National Institute of Information and Communications Technology (NICT): What is WISDOM X? (2022) (in Japanese). 〈https://www.wisdom-nict.jp/#top〉
- [23] Oh, J.-H., Torisawa, K., Hashimoto, C., Iida, R., Tanaka, M., and Kloetzer, J.: A semi-supervised learning approach to why-question answering, Proceedings of AAAI-16, pp.3022–3029 (2016).
- [24] Hashimoto, C., Torisawa, K., Kloetzer, J., Sano, M., Varga, I., Oh, J.-H. and Kidawara, Y.: Toward future scenario generation: Extracting event causality exploiting semantic relation, context, and association features, Proceedings of ACL 2014, pp.987–997 (2014).
- [25] Oh, J.-H., Kadowaki, K., Kloetzer, J., Iida, R. and Torisawa, K.: Open domain why-question answering with adversarial learning to encode answer texts, Proceedings of ACL 2019, pp.4227–4237 (2019).
- [26] Kadowaki, K., Iida, R. Torisawa, K., Oh, J.-H., and Kloetzer, J.: Event causality recognition exploiting multiple annotators' judgments and background knowledge, Proceedings of EMNLP 2019, pp.5820–5826 (2008).
- [27] Oh, J.-H., Iida, R., Kloetzer, J. and Torisawa, K.: BERTAC: Enhancing transformer-based language models with adversarially pretrained convolutional neural networks, Proceedings of ACL-IJCNLP 2021, pp.2103–2115 (2021)
- [28] Impress: Impress DX Awards, Who are the leaders in digital transformation? (2020) (in Japanese). 〈https://dx-awards.impress.co.jp/〉
- [29] NIKKEI Computer: IT Japan Award 2021 (2021) (in Japanese). 〈https://www.nikkeibp.co.jp/atcl/newsrelease/corp/20210608/〉
- [30] Japan Institute of Information Technology: Selected as the winner of the 39th IT Award for 2021 (2022) (in Japanese). 〈https://www.jiit.or.jp/im/award.html〉
- [31] Ministry of Economy, Trade and Industry: Guidelines for Promotion of Digital Transformations Formulated (2018). 〈https://www.meti.go.jp/english/press/2018/1212_003.html〉
- [32] NIKKEI X TREND: The “Meaning of DX” is classified by type of industry (2020) (in Japanese). 〈https://xtrend.nikkei.com/atcl/contents/18/00382/00005/〉
- [33] Kusui, D., Ishikawa, K., Ichinose, N., Okumura, A., Torisawa, K. and Ohtake, K.: Improving Automatic Enterprise Evaluation System WISDOM-DX using QA System based on Web Information, IPSJ SIG Technical Report, Vol.2022-CDS-33, No.40, pp.1–8 (2022) (in Japanese).
- [34] Honnibal, M. and Montani, I.: spaCy 2: Natural language understanding with Bloom embeddings, convolutional neural networks and incremental parsing (2017).
- [35] Asahara, M., Kanayama, H., Miyao, Y., Tanaka, T., Omura, M., Murawaki, Y. and Matsumoto, Y.: Japanese Universal Dependencies Corpora, Journal of Natural Language Processing, Vol.26, No.1, pp.3–36 (2019) (in Japanese).
- [36] Cormack, G. V., Clarke, C. L. A. and Buettcher, S.: Reciprocal rank fusion outperforms Condorcet and individual rank learning methods, SIGIR '09: Proceedings of the 32nd international ACM SIGIR conference on research and development in Information Retrieval, pp.758–759 (2009).
- [37] Voorhees, E. M. and Harman, D. K.: TREC - Experiment and Evaluation in IR. MIT Press (2005).
- [38] Zhou, Z.: Ensemble Methods: Foundations and Algorithms, Machine Learning & Pattern Recognition Series, CRC Press (2012).
- [39] Joachims, T.: A Support Vector Method for Multivariate Performance Measures, Proceedings of the 22nd International Conference on Machine Learning, ACM Press, pp.377–384 (2005).
- [40] Ginsberg, J., Mohebbi, M., Patel, R. Barmmer, L., Smolinski, M., and Brilliant, L.: Detecting influenza epidemics using search engine query data, Nature, Vol.457, pp.1012–1014 (2009).
- [41] Aramaki, E., Maskawa, S. and Morita, M.: Twitter Catches The Flu: Detecting Influenza Epidemics using Twitter, Proceedings of the 2011 Conference on Empirical Methods in Natural Language Processing, pp.1012–1014 (2011).
- [42] Ebata, H.: DX from Marketing Perspective, NIKKEI BP (2020) (in Japanese).
- [43] Goto, M., Harada, S. and Tanabe, W.: Construction of Analogy Evaluation Model based on Structured Strategy Map, Proceedings of the 2007 Fall Conference of Japan Society for Management Information (2007) (in Japanese).
Kai Ishikawa k-ishika@ipa.go.jp
Kai Ishikawa completed the Master's program at the Graduate School of Science of the University of Tokyo in 1996 and joined NEC in the same year. He is currently serving as a Principal Researcher at the Data Science Research Laboratories of NEC and as a technical adviser to the Information-technology Promotion Agency, Japan. He has been engaged in research and development of natural language processing, and received the ANLP Annual Meeting Excellent Paper Award in 1999 and the Kiyasu Special Industrial Achievement Award 2015 from IPSJ. He is a member of IPSJ.
Akitoshi Okumura
Akitoshi Okumura completed the Master's program at the Graduate School of Engineering of Kyoto University in 1986. In the same year, he joined NEC. He was engaged in research and development of natural language processing, speech translation, and artificial intelligence. He is currently serving as Vice Chairman of the Information-technology Promotion Agency, Japan for promoting DX and developing digital human resources. He has received many awards including the Minister of Economy, Trade and Industry's prize at the Advanced Technology Award in 2007, the Kiyasu Special Industrial Achievement Award in 2008, the Yamashita SIG Research Award in 2017, the IPSJ Industrial Achievement Award in 2017, the IPSJ Outstanding Paper Award in 2019, and the Best Paper Award of DICOMO 2019, as well as the JSAI Field Innovation Award in 2010, 2015, and 2016. He is a fellow of IPSJ and a Doctor of Engineering.

Dai Kusui
Dai Kusui completed the Master's program at the Graduate School of Engineering of Kyoto University in 1992. In the same year, he joined NEC. He is engaged in research and development of natural language processing and ICT utilization in the agricultural field. He is currently serving as a Senior Rrofessional in the Innovation Promotion Division of NEC Solution Innovators and as a technical advisor to the Information-technology Promotion Agency, Japan. He received the Products and Technology Award of JSAM in 2017. He is a member of IPSJ.

Noriyoshi Ichinose
Noriyoshi Ichinose completed the Master's program at the Graduate School of Engineering of the University of Tokyo in 1986. He joined NEC in the same year and promoted R&D of software technology and business development including embedded OS (ITRON), real-time UNIX, platform software for the mobile Suica service, Internet service, information retrieval service, new service creation, and agricultural ICT. He is currently serving as an expert at the Information-technology Promotion Agency, Japan for promoting DX. He was awarded the IPSJ SIG Research Award in 1990.

Kentaro Torisawa
Kentaro Torisawa graduated from the University of Tokyo in 1992. After receiving an MSc in Computer Science from the Graduate School of Science of the University of Tokyo, he became an assistant professor in the same school in 1995. In 2001, he was appointed Associate Professor at the School of Information Science of the Japan Advanced Institute of Science and Technology. Since 2008, he has been working at NICT and has been an NICT fellow since 2020. He is currently serving as Associate Director General of the Universal Communication Research Institute (UCRI) in NICT, and as a distinguished researcher at the Data-driven Intelligent System Research Center in UCRI, NICT. He has received many awards/grants including the JSPS prize, the Commendation for Science and Technology by the Minister of Education, Culture, Sports, Science and Technology, the Docomo Mobile Science Award, the Rinzaburo Shida Award, and Twitter Data Grants. Also, he is a visiting professor at the Nara Institute of Science and Technology and a member of the Science Council of Japan. He is a fellow of IPSJ.

Kiyonori Otake
Kiyonori Otake received B.Eng, M.Eng, and Dr.Eng degrees in 1996, 1998, and 2001, respectively, from Toyohashi University of Technology. In 2001, he joined the ATR Spoken Language Translation Research Laboratories. In 2006, he joined the Spoken Language Communication Group, NICT. In 2010, he joined the Language Infrastructure Group, NICT. In 2011, he was lent out to the Director General for Science, Technology and Innovation Policy in the Cabinet Office, Government of Japan as a trainee. In August 2012, he returned to NICT. In July 2013 he held the additional post of Director of the Information Distribution Platform Laboratory at the Resilient ICT Research Center. He is currently serving as Director General of the Data-driven Intelligent System Research Center, and as an Executive Researcher at the Sustainable ICT Systems Laboratory in Resilient ICT Research Center. He has received many awards/grants including the Commendation for Science and Technology by the Minister of Education, Culture, Sports, Science and Technology, the Docomo Mobile Science Award, and Twitter Data Grants.
採録日 2023年4月21日