Quantitative Analysis of Mid-face Correction Treatment using Automated Image Analysis
1. Introduction
Malocclusion accompanied by deformity of the upper and lower jaw affects the quality of lives of people, especially with respect to chewing, swallowing, phonating, and the motion of jaws themselves. It also is one of the direct causes of oral frailty that shortens healthy life expectancy by increasing the possibility of fall risk [5]. Adjustment of jaw positions in surgery has been based on the hard tissues such as maxilla (upper jaw), mandible (lower jaw), and teeth (see A.1), which was suitable for incorporating tomographic imaging technologies that brought tangible surgery simulation for improving the efficacy and accuracy [3]. Recent progress on three dimensional imaging technologies has enabled simulating the anticipated effects by the surgery. That, on the other hand, is the reason why the information about soft tissues deformed by the surgery has not been piled up that much [2], [4], [10]. Co-occurring changes in the soft tissues that cover the repositioned jaw bones and teeth vary among individuals, which is hard to estimate beforehand and has ended up with being left to the empirical knowledge or hunch of the surgeons. Possible problems in the facial appearance after surgery, however, throw even greater negative impact on the quality of the life, that must be clearly explained and understood in the process of informed consent before surgery. Easy and inexpensive methods for collecting evidences regarding soft tissues have been awaited.
This research has developed an image analysis system that is capable of quantitatively measuring the effect of orthognathic surgery over soft tissues. A surgeon takes photographs of the patient's face from the side before and after the surgery in compliance with cephalometric analysis and reads them into the proposed system. The system lets the user click on the landmark points using computer mouse on the profile face images for locating interesting regions and calculating shapes and lengths of soft tissues such as cheek bulge. It helps surgeons record, review and compare the results of surgical treatment for optimizing care and ultimately accumulate evidences in the medical network.
This paper describes what to measure for quantifying soft tissues on face, which is the requirement for image analysis, the detail of the proposed system, and the experiments for demonstrating the efficacy of the proposed method. The experiment firstly visualized the results of jaw surgery for Class II (mandible deficiency) and III (maxilla deficiency) [6] and secondly demonstrated the capability of the proposed method by showing the statistics of the measurements on the soft tissues in the treatment of Class III with upper jaw movement where the effects by additive sliding genioplasty on cheek region and lip region have not been quantitatively investigated in the past [7].
2. Jaw Treatment and the Image Features
2.1 Jaw Deformities and Surgical Treatment
Jaw deformities are classified into three classes as Class I (normal), Class II (maxilla protrusion and mandible deficiency), and Class III (maxilla deficiency and mandible protrusion) [9]. Both Class II and III patients require orthognathic surgery in the case that jaw problems cannot be resolved by orthodontics alone where upper and lower jaw bones are moved either backward or forward horizontally and/or either upward or downward vertically with cutting jaw bone. The surgical treatment expects improving jaw functions together with making facial appearance favorable to the patients.
2.2 Changes in Soft Tissues by Jaw Treatment
Maxillary backward with moving mandibula forward for Class II patients (e.g., Le Fort I osteotomy and Sagittal split ramus osteotomy) anticipates to move mental protuberance forward. The line connecting between nose top and mental protuberance is called “aesthetic line” (E-line in short) which has been widely used as the standard for defining well-proportioned position of lip [8]. The relative position of the mental protuberance to the E-line is of interest in the context of jaw treatment.
Maxillary advancement with moving mandibula backward for Class III patients anticipates to increase the area of cheek region. When maxillary advancement accompanies impaction (upward movement of maxilla molar part), the maxilla makes clockwise rotation in the profile view of face (Fig. 1). Genioplasty, on the other hand, slides the chin forward that is supposed to increase the area of the region surrounded by the E-line and face that anticipates to avoid the problem of chin retruding.
![An example cephalometric images before and after the surgery with maxillary impaction with sliding genioplasty [7].](TR0302-04/image/3-2-4-1.png)
2.3 Facial Features of Interest
Adjustment of jaw positions takes place on the hard tissue of jaw bones and teeth that consequently changes the shapes of soft tissues that cover them. The proposed image analysis method evaluates the shapes of both the cheek bulge and the region surrounded by E-line and face which we call “E-region” [6].
As Fig. 2 shows, cheek bulge is the profile view of soft tissue of cheek protruding over orbicularis oris muscle. It does not produce any linear wrinkling on face but the bulge typically makes a ridge that visualizes the shape of cheek. The proposed method parameterizes the ridge by five connected node points: the uppermost of those points is where the lower end of sagging skin of lower eyelid meets the upper end of cheek bulge, the lowermost of them is the lower end of the marionette line beside mouth corner, the middle of them locates the rightmost (the most frontal) points along the ridge, and two other points interpolate them.
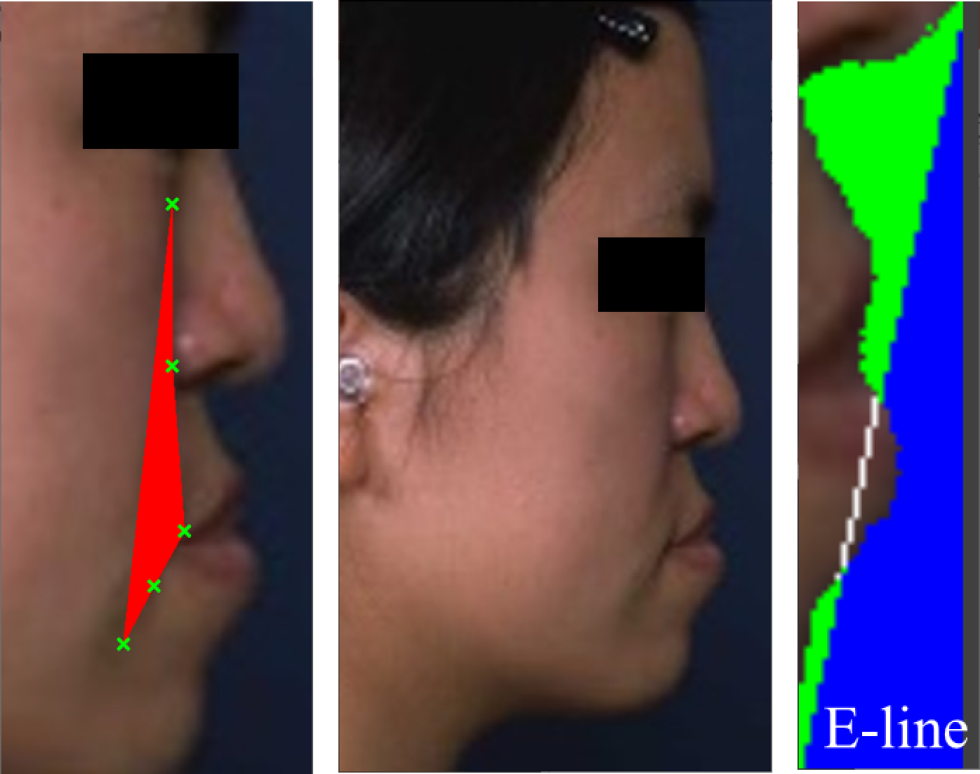
E-region (green area to the right in Fig. 2) which is the background of face surrounded by E-line and skin region increases its area when subnasale (the lower end of nose that starts philtrum below) falls deeply from nose top due to maxilla deficiency, and the other side of E-region in Fig. 2 (depicted in blue) that contains lip region that crosses the E-line gets larger when mandibula protrudes.
3. An Image Analysis System of Profile Face
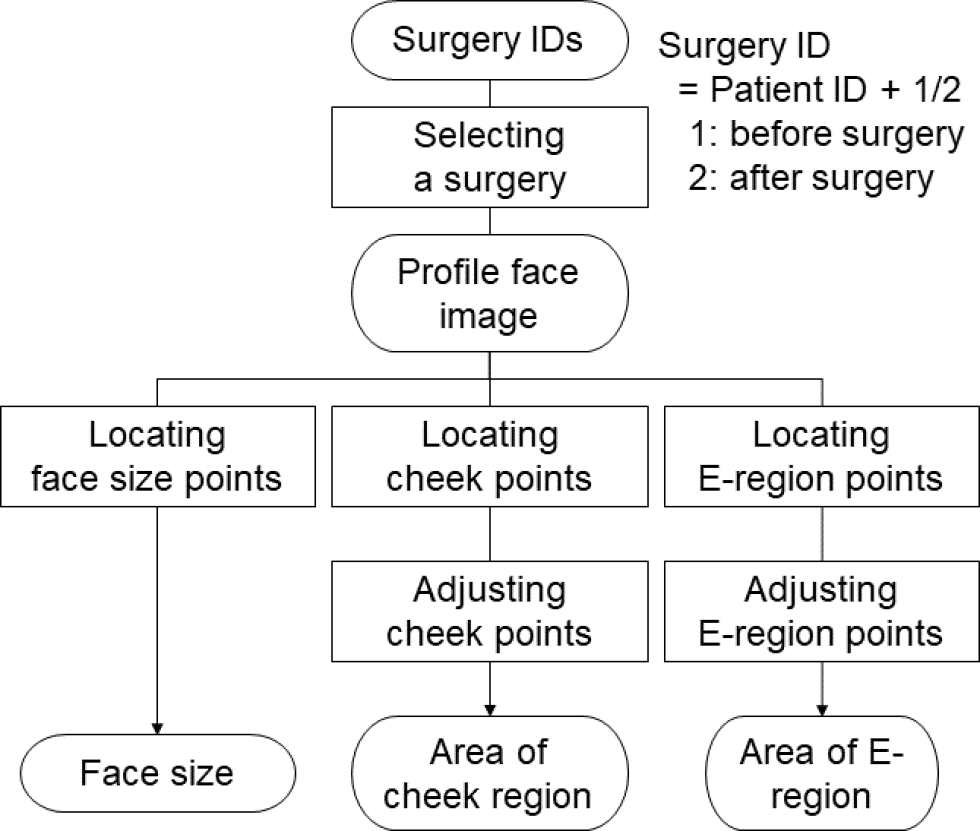
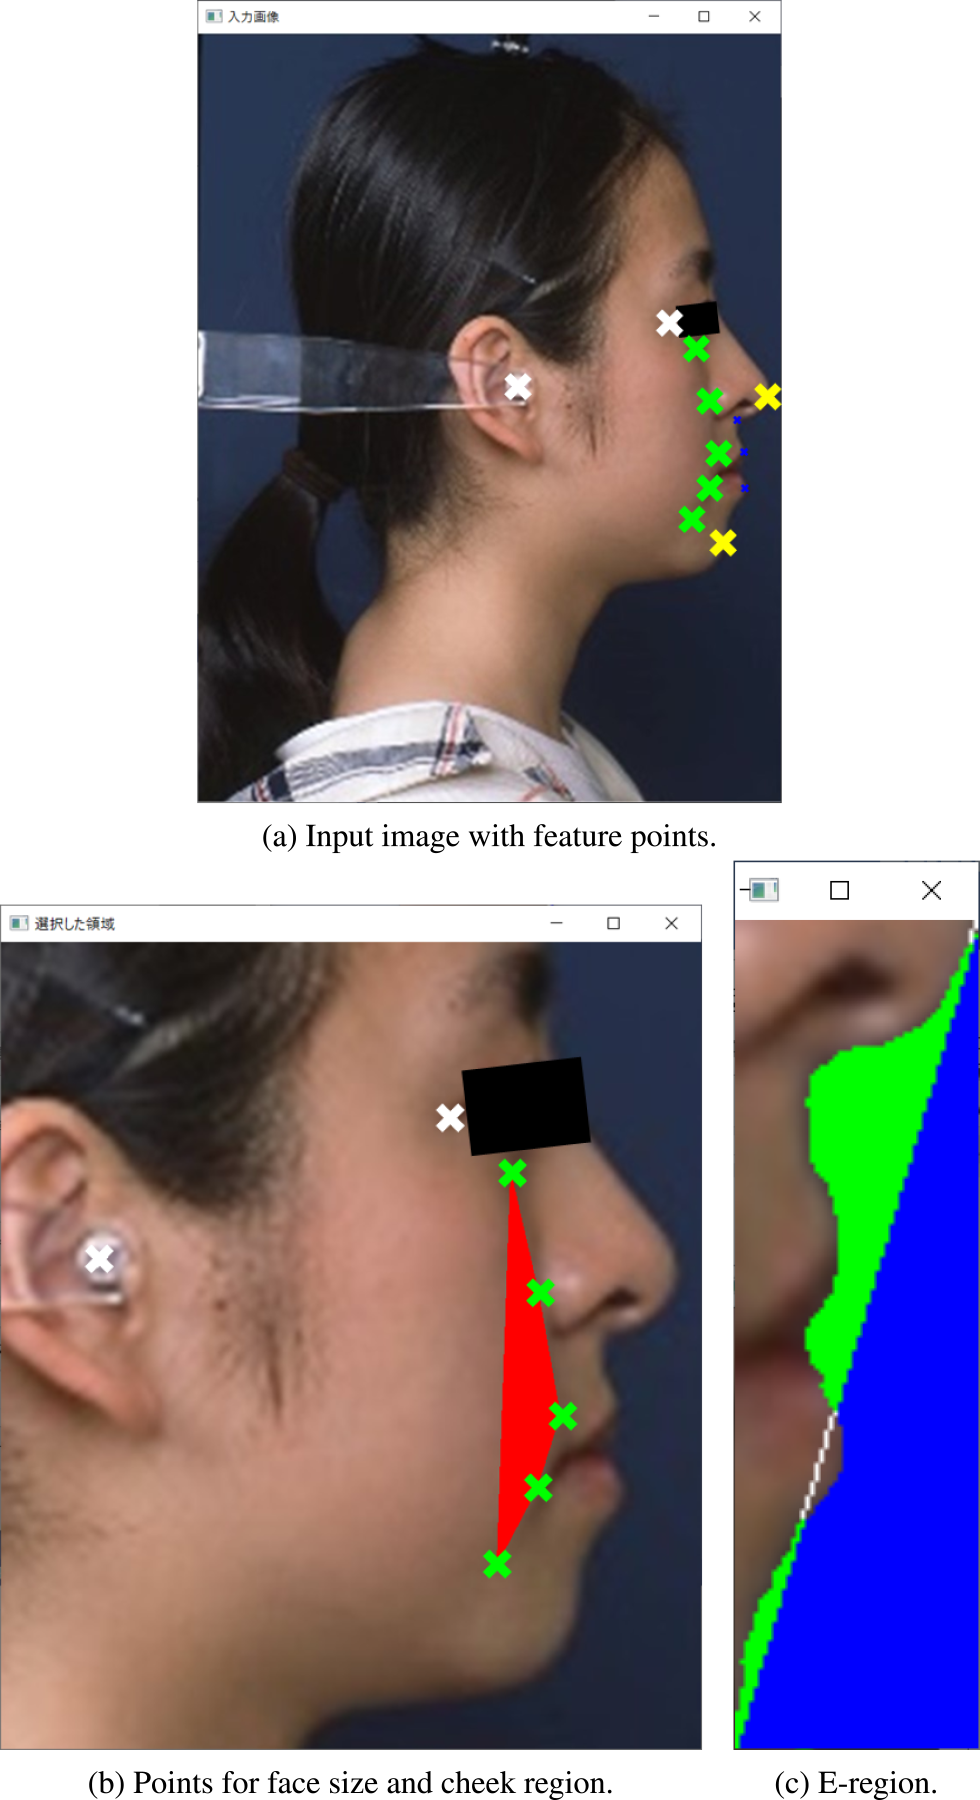
Fig. 3 shows the schematic overview of the proposed automated image analysis system. Selecting a surgery of interest opens a profile face image where the user firstly clicks two points that determines the scale of the face, secondly gives five points for determining cheek region, and finally gives two points for determining E-region (Fig. 5). The following sections explain those steps in detail.
3.1 Selecting a Surgery
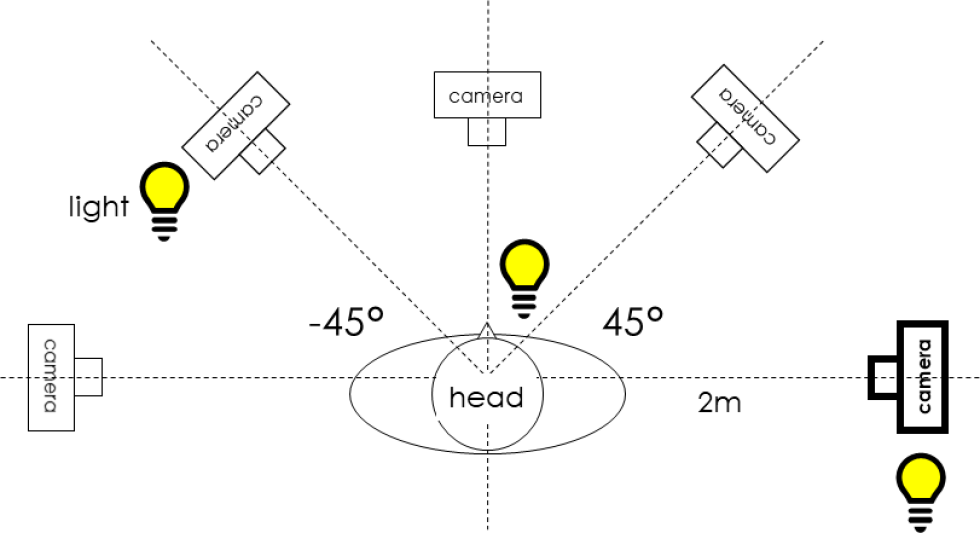
A couple of profile face images of a patient before and after jaw surgery are taken with the camera setting shown in Fig. 4 and stored with the filename of surgery ID that consists of patient ID and either 1 (before the surgery) or 2 (after the surgery) in the image database. The proposed system shows the list of all the surgery IDs in the initial window from which the user can select one for opening the profile face image.
The user is then required to specify the face size, the cheek points, and the E-region points using simple mouse clicking.
3.2 Locating Face Size Points
The face size is defined by the distance between the outer end of upper eyelid and the center of ear rod (the distance between two white points in Fig. 5(b)).
Because images may be taken in other camera settings, the area (the number of pixels in cheek region and E-region) even for the same person can vary. Dividing those area by the face size can normalize the variation.
3.3 Calculating Area of Cheek Region
With respect to the cheek region (Section 2.3), firstly, the user locates the positions of both the top and the bottom points out of the five points that define the cheek bulge region by clicking on the image, and the system automatically initializes the positions of the intermediate three points so that the five points line up at the equal intervals. Secondly, the user adjusts the middle point so that it locates at the rightmost along the profile silhouette (ridge) of cheek bulge. Thirdly, the user adjusts the remaining two points so that each of them locates right in the middle of adjacent points, respectively. Finally, the system calculates the area of the cheek region surrounded by the five points (red region surrounded by green marks in Fig. 5(b)). The area of cheek region is divided by the face size and stored.
3.4 Calculating Area of E-region
With respect to the E-region (Section 2.3), firstly, the user clicks on the top of nose and the top of chin that defines E-line (yellow marks in Fig. 5(a)), and further clicks a pixel within the region (i.e. E-region) that is surrounded by the E-line and the skin pixels of the face so to determine the color of background wall (the wall is assumed to be monochromatic). The system calculates the number of pixels that have the similar color of the background wall as the area of E-region (green region in Fig. 5(c)). The area of E-region is also divided by the face size and stored.
![The interface for selecting surgeries that meet the specified surgery condition [7].](TR0302-04/image/3-2-4-6.png)
3.5 Management of Surgery Information
The proposed software manages the profile information of the surgery including the amount of both horizontal and vertical adjustment for each of point A, posterior nasal spine (PNS), U-1, U-6, L-1, point B, and Pog that prevalent cephalometric analysis deals with in common [1]. Together with the surgery information such as the surgeon, the patient with the gender and the age, it stores the information about camera image such as the timing of taking the picture of either before or after the surgery, all the results of face analysis and the statistical analysis are stored in the XML format. A major elements of the DOM of the XML format is shown in Fig. 8.
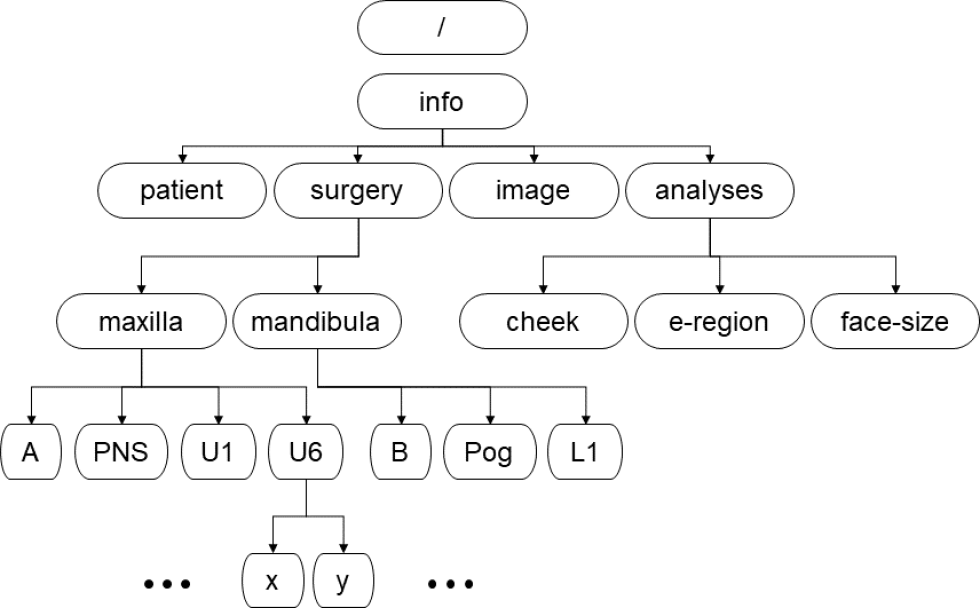
3.6 Surgery Search and Statistical Analysis
Users can search and analyze the specific surgery records from the stored information that match the condition of interest the user specifies (see Sec.3.5). Once a set of records is given the system calculates the basic statistics including the average, the standard deviation, the maximum, and the minimum and store the result into XML format that can be processed and visualized using Web technologies. Future extensions include a function of selecting multiple sets of records for statistical comparison among them.
4. Experiments
4.1 Preliminary Visualization of Various Surgical Cases
Thirteen patients (ten for Class III, i.e. maxilla deficiency, and three for Class II, i.e. mandible deficiency) were measured using the proposed method to obtain the quantitative evaluation of the surgical treatment.
Fig. 7 shows the result of calculating the areas explained in Section 3. Looking at the results for patient F1 and F4, it is quantitatively demonstrated that F1 increased the amount of cheek bulge after surgery whereas F4 did not, inversely F4 increased the area of E-region whereas F1 did not. This kind of notice in the result of soft tissue due to surgical treatment of jaw deformity is enabled for the first time by the quantitative visualization as proposed.
![Examples of visualized volumes of soft tissues for both Class II and III [6].](TR0302-04/image/3-2-4-8.png)
4.2 Application to Comparison between Surgical Conditions
Thirty-eight patients had surgery of maxilla adjustment for treating maxilla deficiency (Class III) (see Table 1 in detail). As explained in Section 2.2, maxillary movement to the direction of patient's front expects the cheek region to increase the bulge that is supposed to make the cheek area in the profile face larger. On the other hand, sliding genioplasty applied together with maxillary impaction expects the chin region including lower lip to move forward that is supposed to increase the area of E-region in the profile face. Past orthognathic surgery has not used any quantitative measures for planning and evaluating those changes in soft tissues and only hard tissues have been taken into account.
![The number of patients correspondent with the treatment conditions of maxilla movement for Class-III (x-coordinate means horizontal movement to the direction of patient's front, y-coordinate vertical movement with the upward direction as positive, “w/” surgery with genioplasty, and “w/o” that without genioplasty.) [7].](TR0302-04/image/3-2-4-9.png)
Here, the area changes in both cheek region and E-region were measured as explained in Section 3.3 and Section 3.4 and averaged over patients according to the surgery conditions, i.e. one with genioplasty for chin reposition and the other without it, respectively (The red bars versus blue ones in Fig. 9). With respect to the area change in cheek region shown in Fig. 9(a), the average values were compared using t-test to see whether or not there was a significant difference between those surgery conditions and found no significant difference. On the other hand, the area changes in E-region Fig. 9(b) indicated a significant difference (“**” in the graph means the significant level p<0.01) [7].
![Effect of genioplasty on the area change of face regions [7].](TR0302-04/image/3-2-4-10.png)
This comparison quantitatively demonstrated that genioplasty was effective on chin reposition in maxilla adjustment for treating Class III, which increased the area of E-region significantly as shown in Fig. 9(b), without interfering the effect of making bulge on cheek region (Fig. 9(a)). It supports the empirical knowledge of oral surgeons on sliding genioplasty and makes it concrete by recording the amount and the direction of maxilla movement including front teeth angle in the surgery together with the result. Due to the elasticity of soft tissues, genioplasty, a surgery on chin point, could affect all over face including cheek region, and the effect is not necessarily predictable from the observation on hard tissues. Such quantitative records are useful in surgery planning in future.
4.3 Discussion
Specifying face points for defining both cheek bulge region and E-region were manually done in the current implementation of the software as explained in Section 3. It allows individual difference among users. Although experimental analysis of the effect is necessary, we consider it ignorable because those points reflect the anatomical structure of the subcutaneous tissue and clearly visible on camera images.
Nevertheless the proposed method is simple and completely novel (e.g. it newly calculates the area of E-region though past surgery only looked at E-line.), the output including its statistical analysis mentioned in the previous section agrees with the direction that expertise admit, which is an accomplishment.
A report by the surgeon, yet, clarified the shortage of the proposed method, that is, the measurements of the proposed method are based on pixels obtained from image analysis (even though they were normalized by face size) that is different from the metric system used in surgery. Future system should reduce the workload in using the system by giving surgeons intuitively clear sense of lengths for planning and evaluation of surgery.
5. Conclusion and Future Works
This research has developed an automated image analysis methods for evaluating the changes in soft tissues caused by surgical treatment of jaw deformity. Preliminary experiment visualized the image features of thirteen surgery conditions including patients with jaw problems of Class II and III and confirmed that the proposed computer-aided image analysis of quantitative evaluation of soft tissues on face including cheek bulge and structure of mouth region referred to as E-region demonstrated that the measurements were capable of visualizing the movements of both mandible and maxilla by jaw surgery. Further experiment evaluating the effect of sliding genioplasty in the surgery for Class III patients on both cheek region and E-region demonstrated that the proposed method was capable of statistically verifying the efficacy of genioplasty.
The proposed method enables a technology that is capable of superimposing a computer graphics of predicted appearance of soft tissue over the patient's face, which not only makes the process of surgery planning easier and more accurate, but also contributes to make informed consent much informative. Such introduction of a digital technology enhances the quality of life and contributes to realize super smart society.
Accumulated knowledge of the relation between various conditions of orthognathic surgery and measured appearance changes in soft tissues using the proposed method will help jaw surgery increase the predictability in the planning and the reliability. Such conditions of orthognathic surgery need to include moving maxilla or mandible forward or backward at smaller or greater than 3 mm, impaction, and maxillary parallel upward movement with various amount for both Class II and III, and data collection from a variety of clinical cases considering gender and age will continue until a certain statistical trends are noticeable.
Future works for improving the proposed method include parameterizing mouth shapes more in detail and making data collection protocol open and available for all the community members over the internet for speeding up the process of increasing the number of surgery data for further statistical analyses.
Acknowledgment This work was supported by JSPS KAKENHI Grant Number JP19K12210.
References
- [1] Burstone, C. J., James, R. B., Legan, H., Murphy, G. and Norton, L. A.: Cephalometrics for orthognathic surgery, Journal of Oral Surgery (American Dental Association: 1965), Vol.36, No.4, pp.269–277 (1978).
- [2] Choi, J., Lee, J., Oh, T., Kwon, S., Yang, S. J. and Koh, K. S.: Frontal soft tissue analysis using a 3 dimensional camera following two-jaw rotational orthognathic surgery in skeletal class III patients, Journal of cranio-maxillo-facial surgery : official publication of the European Association for Cranio-Maxillo-Facial Surgery, Vol.42, No.3, pp.220–226 (2014).
- [3] Han, Y.-S. and Lee, H.: The Influential Bony Factors and Vectors for Predicting Soft Tissue Responses After Orthognathic Surgery in Mandibular Prognathism, Journal of oral and maxillofacial surgery : official journal of the American Association of Oral and Maxillofacial Surgeons, Vol.76, No.5, pp.1095.e1–1095.e14 (2018).
- [4] Lai, H.-C., Denadai, R., Ho, C.-T., Lin, H.-H. and Lo, L.-J.: Effect of Le Fort I Maxillary Advancement and Clockwise Rotation on the Anteromedial Cheek Soft Tissue Change in Patients with Skeletal Class III Pattern and Midface Deficiency: A 3D Imaging-Based Prediction Study, Journal of Clinical Medicine, Vol.9, p.262 (online), DOI: 10.3390/jcm9010262 (2020).
- [5] Eto, M. and Miyauchi, S.: Relationship between occlusal force and falls among community-dwelling elderly in Japan: a cross-sectional correlative study, BMC Geriatr, Vol.18, No.1, p.111 (2018).
- [6] Moriyama, T., Izumi, K., Miyahara, K., Kajiwara, K. and Sato, M.: A Quantitative Evaluation of Forehead Correction Treatment Using Automated Image Analysis, 2021 IEEE 3rd Global Conference on Life Sciences and Technologies (LifeTech), pp.244–246 (2021).
- [7] Moriyama, T., Izumi, K., Miyahara, K., Kajiwara, K. and Sato, M.: Statistical Analysis of Midface Correction Treatment using Automated Image Analysis, 2021 IEEE 10th Global Conference on Consumer Electronics (GCCE 2021), pp.683–684 (2021).
- [8] Ricketts, R. M.: A foundation for cephalometric communication, American Journal of Orthodontics, Vol.46, No.5, pp.330–357 (online), DOI: https://doi.org/10.1016/0002-9416(60)90047-6 (1960).
- [9] Takatsuji, H., Kobayashi, T., Kojima, T., Hasebe, D., Izumi, N., Saito, I. and Saito, C.: Effects of orthognathic surgery on psychological status of patients with jaw deformities, International Journal of Oral and Maxillofacial Surgery, Vol.44, No.9, pp.1125–1130 (online), DOI: https://doi.org/10.1016/j.ijom.2015.02.003 (2015).
- [10] Wermker, K., Kleinheinz, J., Jung, S. and Dirksen, D.: Soft tissue response and facial symmetry after orthognathic surgery, Journal of Cranio-Maxillofacial Surgery, Vol.42, No.6, pp.e339–e345 (online), DOI: https://doi.org/10.1016/j.jcms.2014.01.032 (2014).
Appendix
A.1 Conventional Cephalometric Analysis
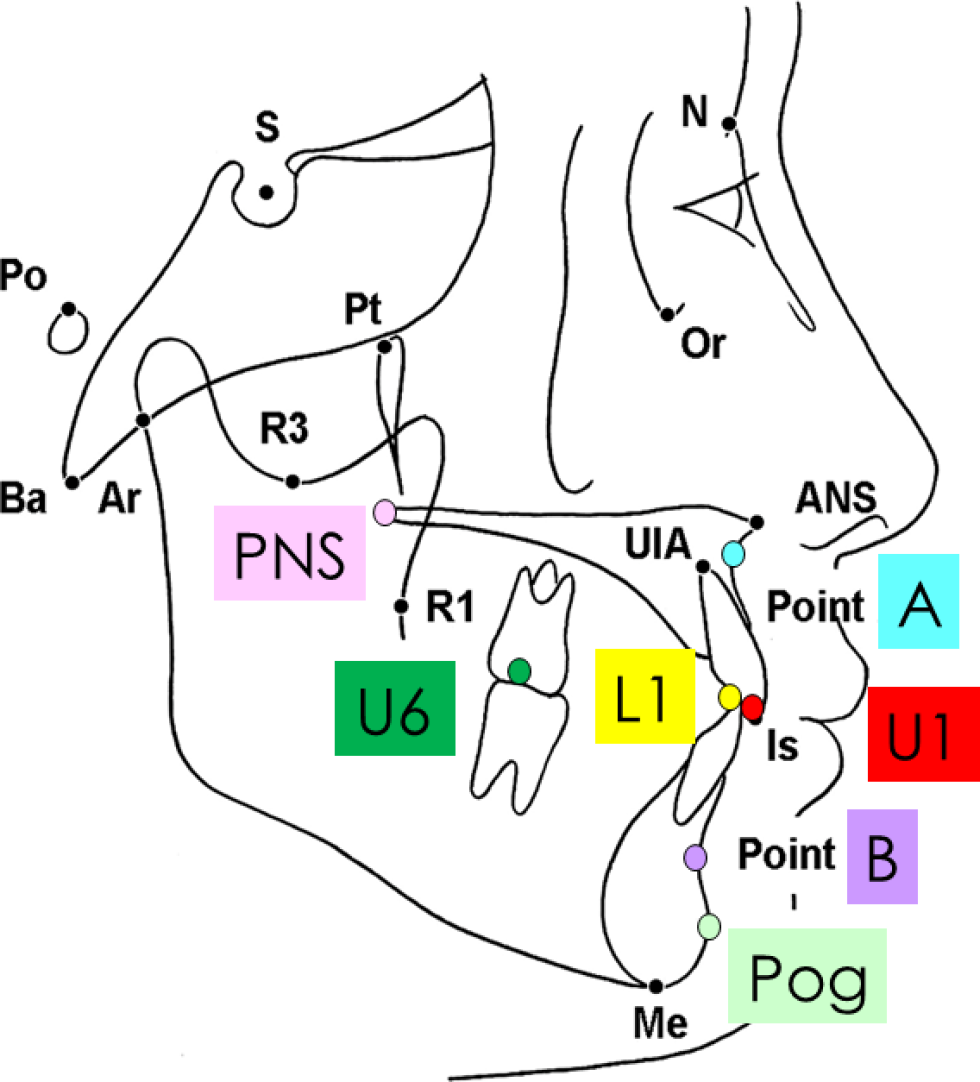
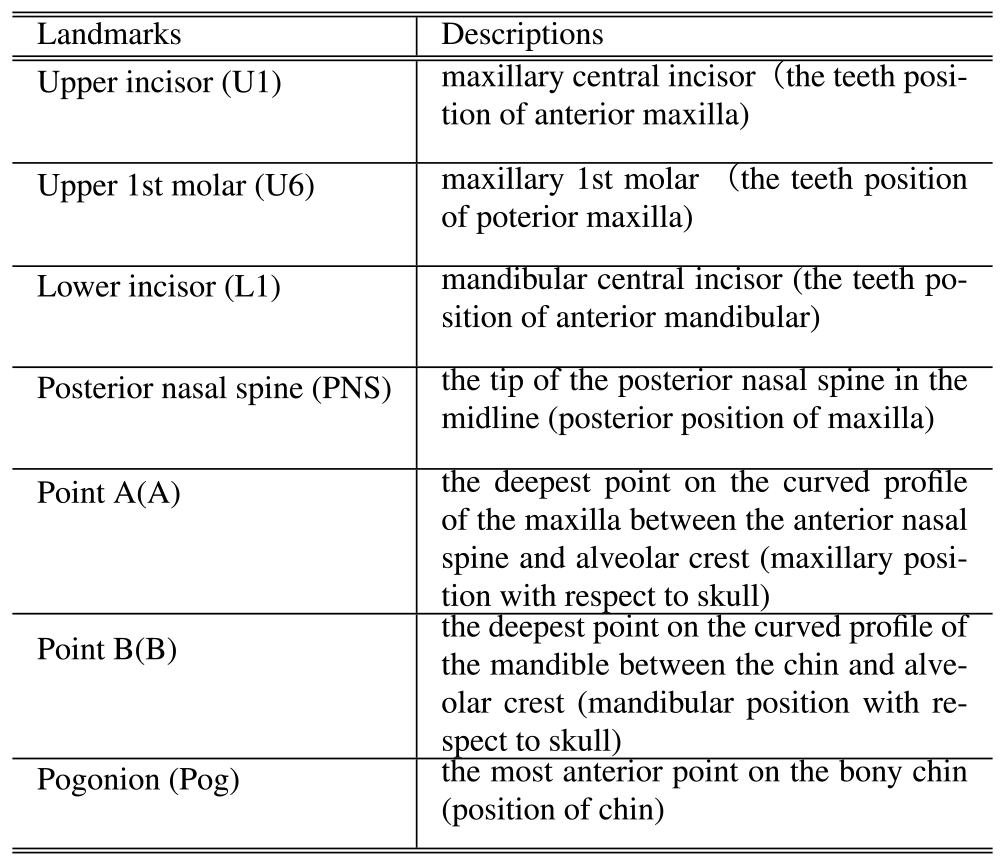
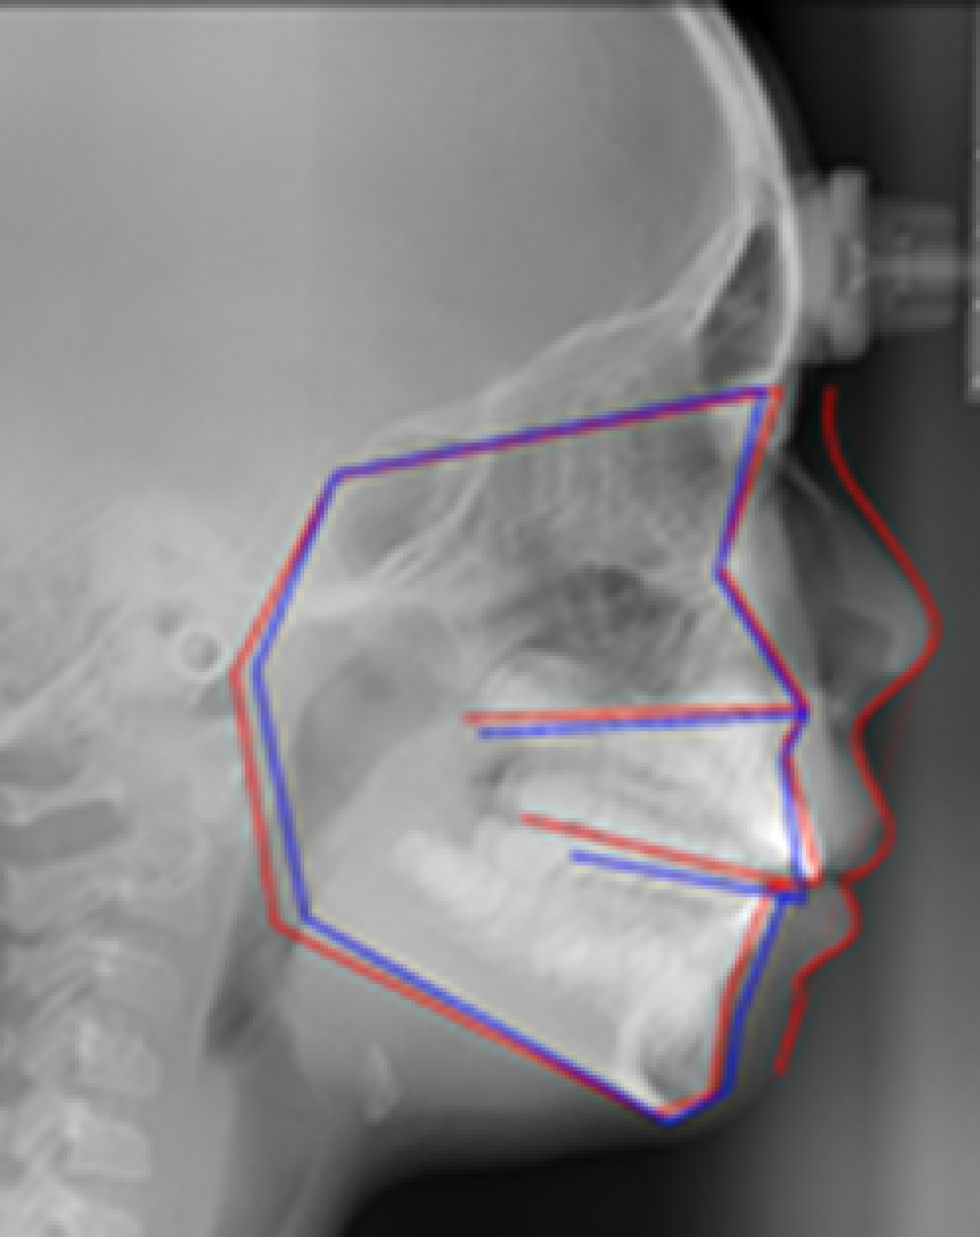
The landmarks depicted in Fig. A・1 are located on hard tissue for planning and evaluating surgery in general where the colored landmarks indicate the ones that the proposed system use as the conditions for surgery search (see Table A・1 for explanation). Their positions and the interesting angles formed by several combinations of three landmarks (e.g. SNA: the angle between side SN and side SA) are evaluated and compared with the standard (the mean ± 1SD). Also, the polygon formed by S→N→Or→ANS→U1→L1→B→Pog→Me→Go→Ar→S, which is called a profilogram (see Fig. A・2), has been used for evaluating the total balance by comparing with the standard.

Tsuyoshi Moriyama moriyama@t-kougei.ac.jp
Tsuyoshi Moriyama received his M.E. and Ph.D. from Keio University, Japan, in 1996 and 1999, respectively. He became an associate professor at Tokyo Polytechnic University in 2017. His research interest covers a wide variety of multidisciplinary areas with respect to behavioral analysis for improving quality of lives of humans by preventive medicine. He received the IEICE Young Investigators Award 1998. He is a senior member of IPSJ.

Kiwako Izumi kiwachan@college.fdcnet.ac.jp
Kiwako Izumi received her D.D.S. and Ph.D. from Fukuoka Dental College in 2000 and 2004, respectively. She got her dentist's license (Japan) in 2000 and became a board-certified trainer of the Japanese Society of Oral and Maxillofacial Surgeons in 2016 and a hospital associate professor at Fukuoka Dental College in 2018 and a professor at Fukuoka College of Health Science in 2019. Her current research interest is quantitative analysis of facial change in jaw deformity. She is a delegate of AOCMF and a member of the ICOMS.
Kei Miyahara
Kei Miyahara received his D.D.S. from Fukuoka Dental College in 2017 and entered graduate school of dental science in 2020. He got his dentist's license (Japan) in 2019. His current research interest is quantitative analysis of facial change in jaw deformity. He is a member of the JSOMS.
Koichiro Kajiwara
Koichiro Kajiwara received his D.D.S. and Ph.D. from Fukuoka Dental College in 2012 and 2017, respectively. He got his dentist's license (Japan) in 2012 and became a board certified member of the Japanese Orthodontic Society in 2019 and an assistant professor at Fukuoka Dental College in 2000. His current research interest is preventive medical research on the diabetic exacerbation chain caused by periodontal disease. He is a member of the JOS and JSP.
Mamoru Sato
Mamoru Sato received his B.Sc. from Suzuka University of Medical Science in 2009. He got his radiological technologist's license (Japan) in 2010 and became a staff of Fukuoka Dental College Hospital in 2014. His current research interest is construction of cervical lymph node visualization system using projection mapping function. He is a member of the JSOMR.
再受付日 2021年11月8日
採録日 2021年12月21日
会員登録・お問い合わせはこちら
会員種別ごとに入会方法やサービスが異なりますので、該当する会員項目を参照してください。