Application of ICT to Support Sustainable Fisheries Management: Bali Sardine Fishery, Indonesia
1. Introduction
Advances in information and communication technology (ICT) have opened many possibilities for its application in various sectors [1]. Information technology has revolutionized the agricultural sector, especially in the areas of biotechnology and seeding [2]. Studies have shown that ICT has benefited the agricultural sector by increasing the efficiency of automatic harvesting machines [3] and by improving plant genotyping in Indonesia [4].
The development of ICT in the fisheries sector worldwide, especially in fisheries monitoring and data collection, has been documented previously [5], with the subsequent creation of steps and procedures for designing and developing technology for fisheries monitoring. This monitoring includes data collection, regulatory compliance, and vessel monitoring and is a critical determinant of the success of fisheries management.
The use of ICT in fisheries data collection is increasing and becoming a major trend worldwide, including in Indonesia. Rapid advances in ICT provide many possibilities for expanded applications, including the collection of real-time digital and accurate fisheries data as well as data sharing between fisherman, improved analysis of catch effort data, better spatial fish density mapping and stock calculation, and improved fisherman livelihoods through higher fishery incomes [6]-[8] and [9].
The overall objectives of the development and implementation of ICT in Bali sardine fishery are to provide better stock assessments to accurately estimate and visualize the stock conditions and to develop a decision support system and management framework. This can provide solutions for sustainable fisheries management and recovery as well as the establishment of smart fisheries, enabling data sharing and fisheries management interaction/engagement between stakeholders through ICT aimed at realizing sustainability. Conceptual framework of fisheries management measures and harvest strategy development to achieve sustainable fisheries through a robust estimation of the stock, defining the goal and setting up the measures are describe by [10].
This paper describes the application of ICT to support small-scale sardine fishery management in Bali. First, in Section 2, Bali sardine fishery, adaptive fisheries, existing applications of ICT in fisheries and a conceptual framework for the application of ICT in Bali sardine fishery are introduced. Then, Section 3 explains the detailed application of a database system as well as how the ICT system has been developed in the Bali sardine fishery. Section 4 summarizes the results of the practical implementation. Section 5 concludes the paper with an analysis of smart fishery initiation and discusses areas for future work.
2. Related Work
2.1 Adaptive Fisheries Management
World capture fisheries production is increasing year by year. However, the number of catches is currently steady at 90 million tons because fish stocks in most areas of the world are overexploited or collapsed. The aims of the United Nations' Sustainable Development Goal 14 was to effectively regulate harvesting and end overfishing; to end illegal, unreported, and unregulated fishing; to end destructive fishing practices; and to implement science-based management plans to restore fish stocks in the shortest time feasible―all by 2020, but currently the target is not yet 100% achieved, although significant improvement has been made.
Adaptive fisheries management is a set of management approaches for addressing certain problems and overcoming issues identified by assessments [10]. General adaptive fisheries management cycles are presented in Figure 1. Three major components/cycles of harvest strategy formulation for data-poor fisheries are monitoring (including data collection), stock assessment, and management measures or control (decision rules). The conceptual framework for the application of ICT in fisheries management will be based on this adaptive fisheries management framework.
![ICT roles in sustainable fisheries management, developed from the adaptive fisheries management process described in [10].](TR0302-03/image/3-2-3-1.png)
In this study, we evaluate how adaptive fisheries management can be supported by the application of ICT, especially by increasing the quality of data collection and bridging the gap between analysis results and stakeholder understanding by offering tools or a platform for dissemination. The effects and constraints on the implementation of the ICT system for the improvement of fisheries management are also discussed.
2.2 Bali Sardine Fishery
Indonesian capture fisheries currently rank 3rd in production worldwide, with total capture fisheries production of over 6 million tons or 7.3% of the world catch. However, the fish stock in Indonesia is mostly overexploited, and the government has continuously established new regulations and fisheries management strategies to achieve sustainability [6], [11].
Bali sardine purse seine fishery was developed in the late 1970s. Sardine catch from purse seines provides raw materials for canning factories located in the area surrounding the Bali Strait such as Muncar and Pengambengan, protein sources for the local market, and feed for mariculture, especially grouper mariculture. The sardine catch in the Bali Strait increased continuously until the late 1990s and decreased thereafter. The Bali sardine stock is currently overexploited and catches have decreased over the last 10 years. One recommendation [11] to rebuild the sardine stock is to improve data collection and analysis in Bali sardine fishery. ICT is a promising approach for improving data collection.
2.3 Current Applications of ICT in Fisheries
A review of the literature on three countries that account for significant contributions to the world catch and have already established sustainable fisheries management practices (i.e., Iceland, Norway, and the United States) revealed that in order to achieve sustainable fisheries management it is necessary to do the following: obtain reliable and accurate data on fisheries; perform robust stock assessments and establish harvest strategies and management measures; determine quota allocations and implement the total allowable catch (TAC) or acceptable biological catch (ABC) that ensure the catch does not exceed the maximum sustainable yield (MSY); and establish a vessel and catch monitoring system to monitor regulatory compliance. These countries already employ ICT for all aspects of fisheries management, from data collection to stock assessment, management measures, and monitoring [12]-[14], and [15].
A previous study [8] has provided a good example of how the application of ICT can benefit artisanal fisheries management using the a digital diary system for catch monitoring, a GPS automatic transmitter, and GIS analysis. They visualized the current exploitation status of fisheries and helped fishers community to formulate a management policy to recover the stock condition.
3. Application and Database System Development
3.1 Conceptual Framework for the Application of ICT in Bali Sardine Fishery
The roles of ICT in the support of sustainable sardine fishery management in the Bali Strait were established based on adaptive fisheries management described previously [10]. Figure 1 summarizes the roles of ICT in the adaptive fisheries management process. The first step is data collection to determine the stock status. ICT contributes to data collection through the digitalization of capture fisheries data, development of an application for participatory data collection, development of IoT devices to monitor fishing vessels, and generation of a database to store data.
The second step is the assessment of stock status and the analysis and simulation of management procedures/scenarios. ICT contributes to the assessment through data queries as well as statistical, geo-statistical, and surplus production modeling to formulate the sustainable harvesting level. After assessment, the next step in adaptive fisheries management is the development of management procedures. ICT uses the results as benchmarking, simulates results, and provides a stakeholder platform to obtain an acceptable strategy for implementation. ICT further contributes to implementation by dissemination through a smart dashboard, applications, and social media as well as stakeholder capacity building by education and training to ensure that the management measures are applied.
3.2 Digitalization of Landing Data
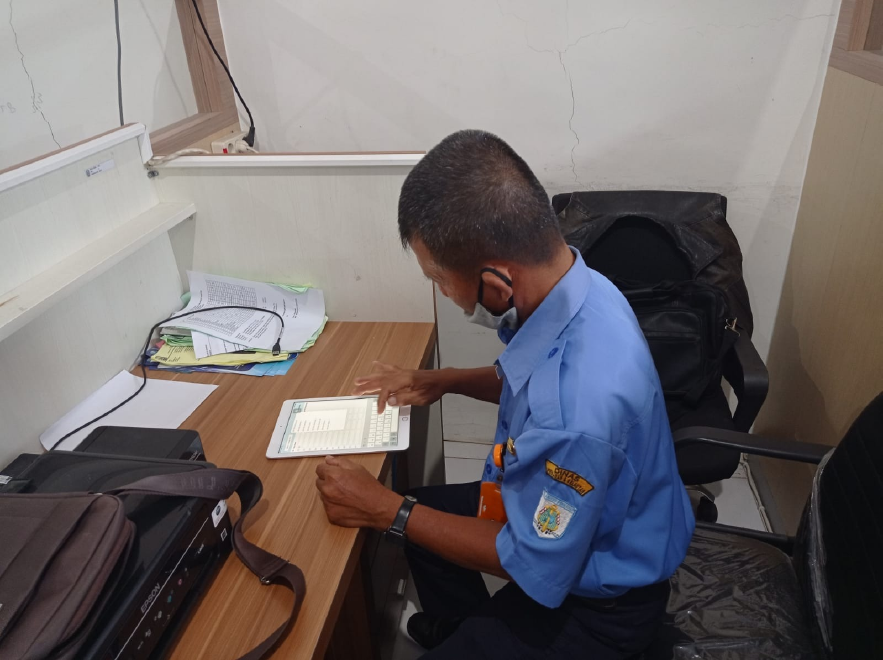
One of the data types collected to determine the stock condition is landing data. In 2018, we conducted field observations, mini-workshops, and discussions with officers in fishing ports to understand the existing data collection process. The Muncar and Pengambengan fishing ports used paper-based data records, as depicted in Figure 2. The paper-based data are then entered into a web-based data entry platform and an Excel spreadsheet. To digitalize the landing database, we developed an application to be utilized like a simplified paper-based data recorder in which the data are stored directly in the devices and database system.
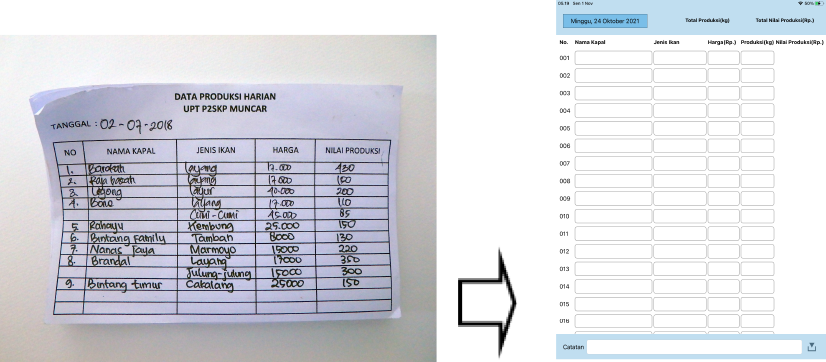
In Figure 2, the MICT-L application menu are presented, the menu is in Indonesian laguange to made the local operator from Indonesia much more easier, on the first line there are 3 information displayed in the application, on left top conner is Day and Date indicator, in the middle is recapitulation of total catch on the day/date presented in kilogram in the menu is Indonesian laguange “Total Produksi (kg)”, and on the right top corner there is information about the total value of the catch on that day/date, in Indonesian language “Total Nilai Produksi (Rp)”. On the menu of the application first column is number indicating the number of data inputed, second column is “nama kapal” (boat name), “jenis ikan” (fish species), “harga” (price), “produksi” (amount of catch in kg), and “nilai produksi” (catch value), the catch value is automatically calculated by the application from the price and catch amount. In the bottom of the menu there is “catatan” (note) to record the special remark during the data input.
For landing data, an iOS-based application was developed, named MICT-L (Marine ICT-Landing), as described in detail in [16]. We describe the data flow and utilization in combination with other data to produce useful information to support fisheries management. Digitalization of capture fisheries landing data offers several benefits, such as ease of data queries, minimization of human errors during data input, simple storage compared with paper-based data as well as ease of data summary and analysis for various reporting purposes.
MICT-L data comprised six data fields: date, boat name, fish species, catch amount, price, and total. Boat name and fish species were pre-installed in the application database; accordingly, the operator/officer only needs to tap on the fishing boat and species list to narrow down candidates. Officers need to enter the catch amount and price manually and the total price is calculated automatically.
Before the data are stored in the database, the officer is able to correct and verify it over a 30 day period. This window of time is requested by the operator/officer; every month, data verification and validation is conducted by all officers, and any necessary corrections after verification and validation can be applied.
3.3 GPS Monitoring
A GPS tracker was installed as a vessel monitoring system to understand the movements, behavior, and fishing grounds for analysis of the origin of captured fish. Two types of GPS tracker, Trekfish and Globalstar Smart-One Solar, were installed on the sardine fishing boats. Trekfish is a local GPS tracker produced by a workshop in Indonesia, while Globalstar Smart-One Solar is a rugged GPS produce by Globalstar in the United States.
A total of 20 Trekfish devices were installed in the fishing boats, including 10 devices in the Muncar fishing port-based vessel and 10 devices in Pengambengan fishing port-based vessel. The Globalstar Smart-one Solar device was installed in eight vessels, including four in Muncar and four in Pengambengan. Both GPS tracker devices were self-powered using a battery and solar panel instrument.
The Trekfish GPS tracker was initially set to automatically transmit data every 2.5 min in order to provide detailed movement information for the fishing vessel. However, because of the limited battery life, this interval was changed to 5 min. The Smart-One Solar devices were set to automatically transmit data every 10 min in January 2021.
The transmitted data consisted of vessel ID, date, time, and position (longitude and latitude). For Trekfish, additional information about the battery level was transmitted. Ideally, we need to install the devices in open and uncovered locations to ensure that the solar panel can effectively harvest energy and connect with the satellite or cellular network.
For good representation of fishing vessel samples and successful installation, the top 30 most active vessels in both Pengambengan and Muncar fishing ports were assessed beforehand. After identifying candidates, we assessed the willingness of fishers to participate in the program by creating a good relationship and providing explanations to the fishers and boat owners. Some fishers did not want to participate, not because they did not want to be monitored but because they did not want to perform the extra work to maintain the devices. To address this issue, it is important to choose devices that require minimal or no maintenance on these vessels.
3.4 Database Development
All data collected from MICT-L and the vessel monitoring system/GPS tracker are stored in an online database platform, developed based on PostgreSQL 11.11 and PHP, stored in an online database server located at the Institute for Marine Research Observation (IMRO) in Bali, Indonesia. The system design and technology stack of the server specifications are presented in Table 1.
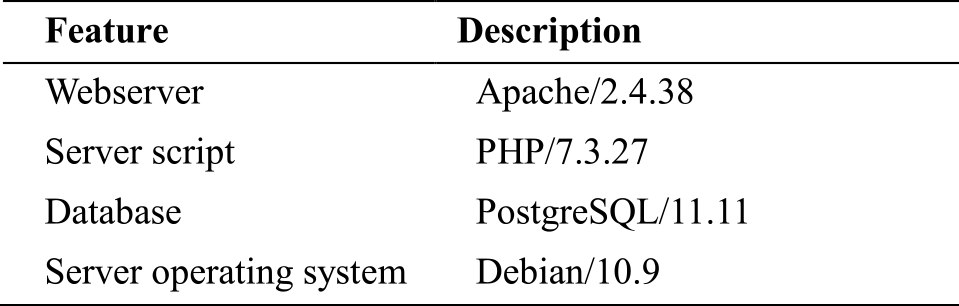
A relational database from the MICT-L application to the database was obtained using a relational database management system (PostgreSQL 11.11), an open-source database software run on Linux (Debian/10.9) capable of storing, querying, and manipulating data. A dedicated online server, ThinkSystem SR650, was installed at IMRO to handle the database and system for the smart fisheries. The data queries were conducted using the PHP web-based application and tabulation, and the statistical data analysis was performed using R open source statistical software.
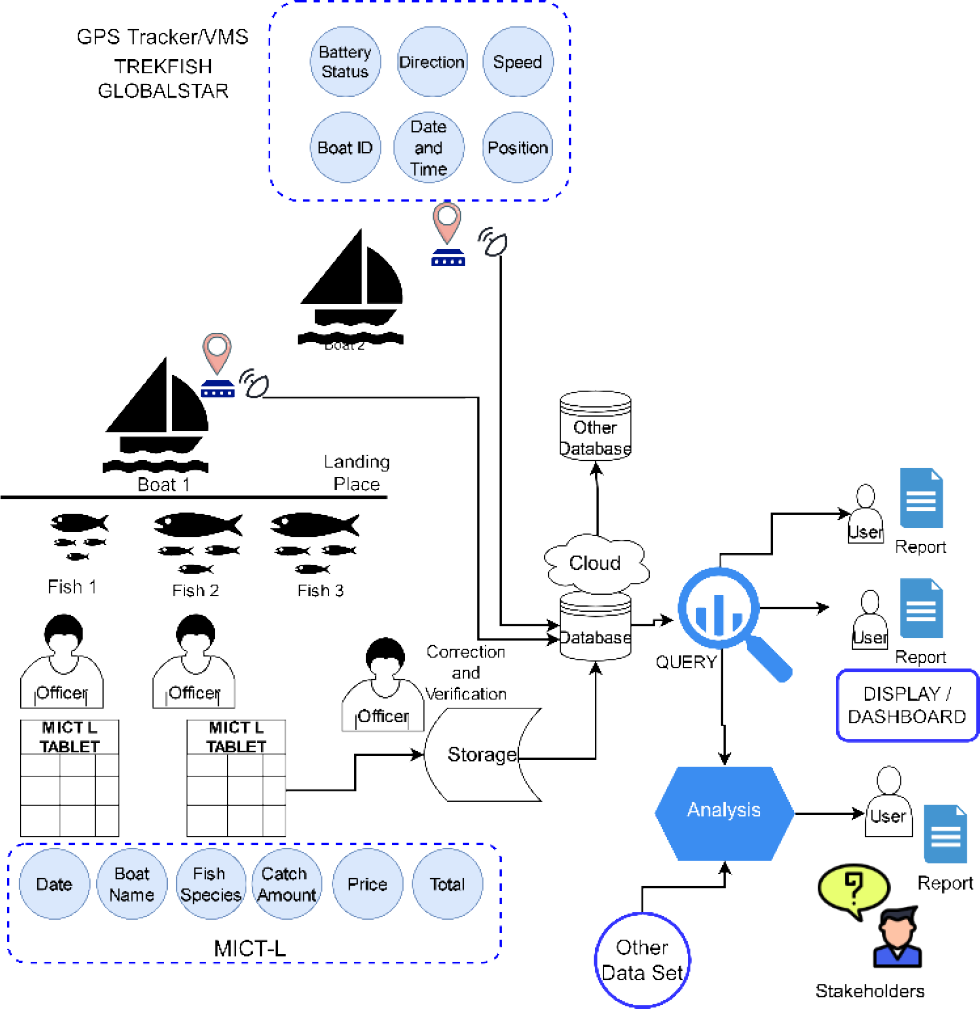
Figure 3 shows the overall concept of the data flow and database arrangement for ICT-based data collection using the MICT-L application and GPS tracker devices. Stored landing and vessel position data in an online server can easily be queried based on user needs. Different users may have different interests and aims. Fishers may need information on potential fishing areas with high catches and information on fish price trends. Fisheries officers need landing data for daily, monthly, quarterly, and yearly reports as well as catch monitoring. Researchers and lecturers will have different interests in the data and might combine the information with another database for analyses and visualization using a smart-dashboard system to inform managers and other stakeholders (Figure 3).
3.5 Data Analysis Framework
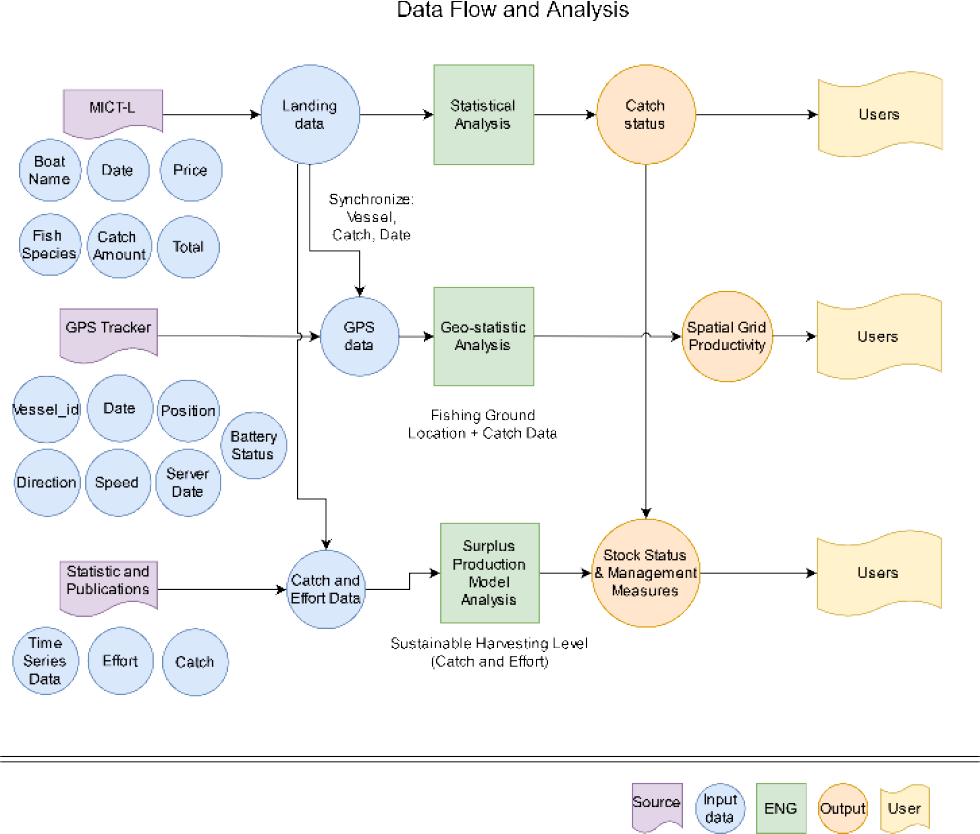
The second process in adaptive fisheries management is assessment, including queries and analyses of data from the database. As shown in Figure 1, we describe three analyses of fisheries datasets, a descriptive statistical analysis of landing data, geo-statistical analysis of spatial grid productivity, and surplus production model analysis to assess the stock status and define management measures. Figure 4 shows the data flow and analysis framework for the assessment using the existing database and published data.
Descriptive statistical analyses were conducted using R opensource statistical software, and MICT-L landing data were directly queried and downloaded from the R console. Data were checked and verified, especially boat name and species name; although these items are pre-defined in the database, users/operators can input information manually, and errors occasionally need to be corrected.
The second analysis type was a spatial grid productivity analysis using geo-statistical methods based on geographical references. For this analysis, we used data extracted from MICT-L and GPS tracker. Figure 4 described the process of combining information from the MICT-L database and GPS tracker database to evaluate the spatial productivity of Bali sardine fishery. The MICT-L dataset consisted of six data fields (i.e., boat name, date, price, fish species, catch amount, and total). The GPS tracker database consisted of seven data fields (i.e., vessel_id, date, time, position, direction, and speed).
To analyze spatial grid productivity, we first need to synchronize the data fields from both databases. Because the MICT-L database lacks the vessel_id field and the GPS tracker database lacks the vessel_name field, we utilized a reference table containing vessel_name and vessel_id from the installation process to convert vessel_id into vessel_name. After vessel_id and vessel name synchronization, we can obtain completed data for further spatial grid analysis. In spatial grid analysis, catches from fishing vessel, represented by fish species, catch amount, and date fields from the MICT-L database, can be assigned to a certain grid based on the geographical position of the vessel extracted from the GPS Tracker database, represented by position and date fields.
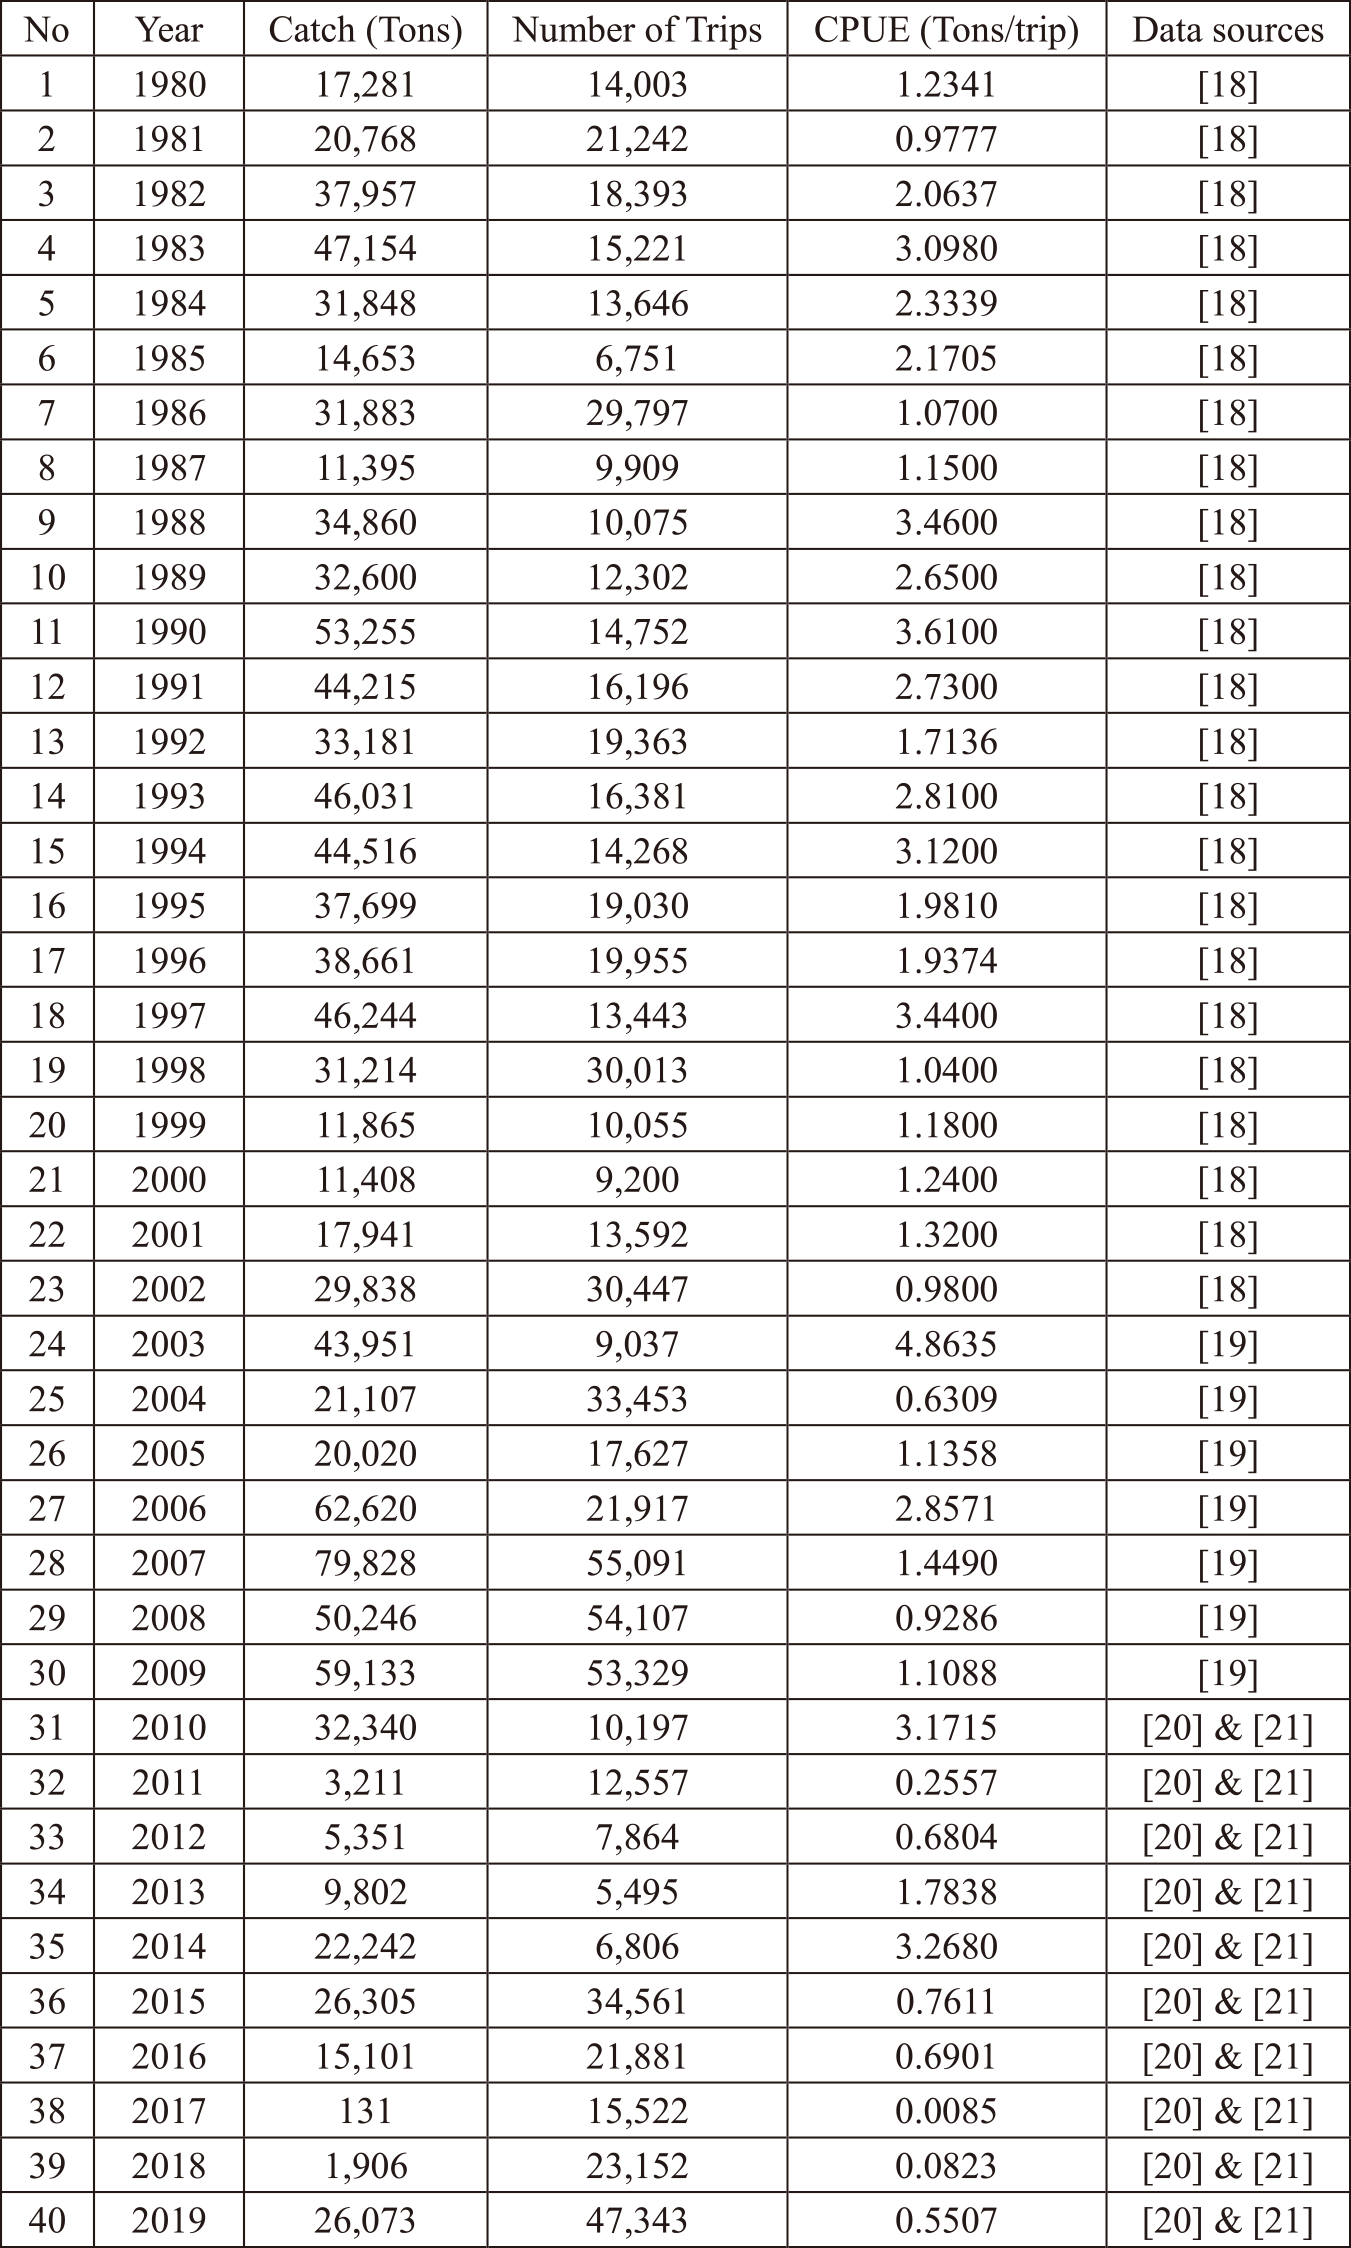
The third analysis is the yearly catch and effort analysis using surplus production modeling. As described in [17], four sources of time series data were utilized, namely previously published yearly catch effort data [18], a doctoral thesis [19], and Muncar and Pengambengan fishing port statistical reports [20], [21]. Complete yearly catch–effort data and data sources are presented in Appendix 1. The sustainable harvesting level of the Bali sardine fishery was determined using a non-equilibrium surplus production model that utilizes the ASPIC tools [22]. Using the estimation from the surplus production model combined with the MICT-L database, we analyzed the current exploitation status of the sardine stock by comparing the cumulative catch from the database. Figure 4 provides an overview of the data flow for analysis of sustainable harvesting levels and stock status as well as management measures.
3.6 Smart Dashboard
The dissemination of analysis results is a crucial step in successful fisheries management. All stakeholders need to be given interpretable analysis results; without proper dissemination, downstream processes cannot be implemented. One initiation for dissemination is the development of a smart dashboard to display real-time landing data and to monitor the exploitation level using analysis results. The smart dashboard provides information for fishers, managers, traders, and academia. The simple interactive visualization of results will ensure a good understanding of the current stock condition and increase awareness about sustainable fisheries.
A smart dashboard system was developed on the Android platform. The application conducts real-time queries directly against the MICT-L database and performs data manipulation and statistical calculations. Results are presented in a simple graphical display for stakeholders.
4. Results and Discussion
4.1 Database Overview and Descriptive Statistics
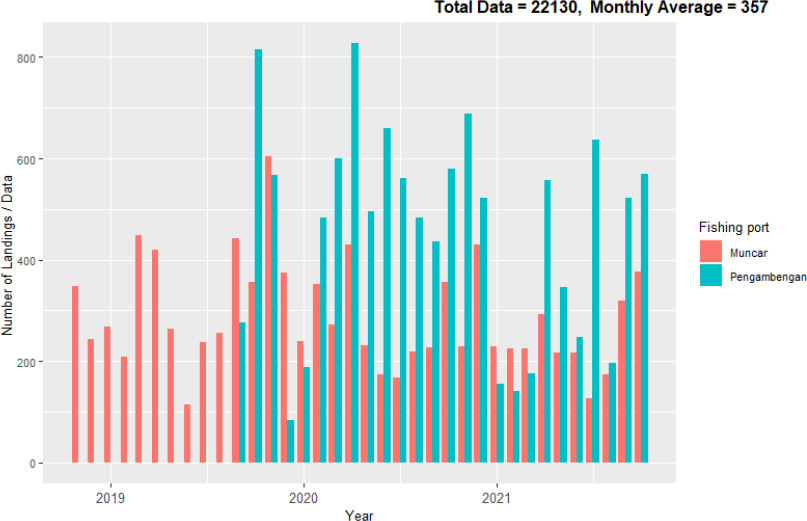
From its development in 2018 up to July 2021, the MICT-L database included 19,795 individual landing data records from both the Muncar fishing port and Pengambengan fishing port (Figure 5). The average data entry rate for MICT-L was 347 records per month and the active fishing duration in Bali Strait was around 20 days, for an average of only 15–20 landing records per day, depending on conditions.
Trekfish GPS tracker devices were installed on November 2019, with 543,060 GPS tracker positions. In 2020, GPS tracker data were substantially reduced due to device-related issues, especially battery failure. Beginning in February 2021, after repairs and reinstallation, the data increased again (Figure 6). Since the installation in February 2021, 98,641 positions from Globalstar SmartOne Solar were recorded. The monthly average data acquisition size was 32,085, and the online server database platform successfully recorded the data from the installed IoT devices and application.
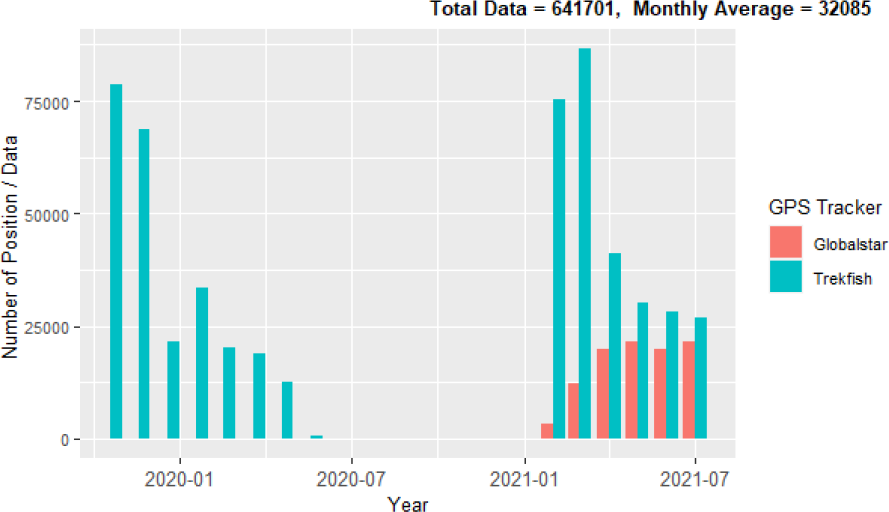
The reliability of the GPS tracker is crucial to the success of system implementation. From experiences in the Bali Strait, the satellite-based model shows better performance than the cellular-based GPS tracker; to avoid issues with data acquisition, it is recomemended to use a highly reliable GPS tracker for a good data transfer rate.
4.2 Data Queries and Analysis
Sustainable Harvesting Level Calculation
In Table 2 depicted the optimal sardine production and fishing efforts in sardine fishery in the Bali Strait [17]. MSY for the Bali sardine fishery was 28,540 tons per year with 10,790 trips per year, this point of estimation then use as TAC level in the exploitation level monitoring.
![Optimal sardine production and fishing efforts in sardine fishery in the Bali Strait [17].](TR0302-03/image/3-2-3-8.png)
The smart dashboard was developed using this baseline information (point estimation); we used TAC to monitor the yearly catch, regardless of whether the cumulative catch is under the TAC level or already reached this point. To improve the dissemination of the results and increase awareness by stakeholders about the sustainable harvesting level, on the smart dashboard, we set a green line limit at below 80% TAC, a yellow line limit above 80% TAC, and a red line limit at 100% TAC. The TAC levels are recalculated on a yearly basis and updated accordingly.
Spatial Productivity
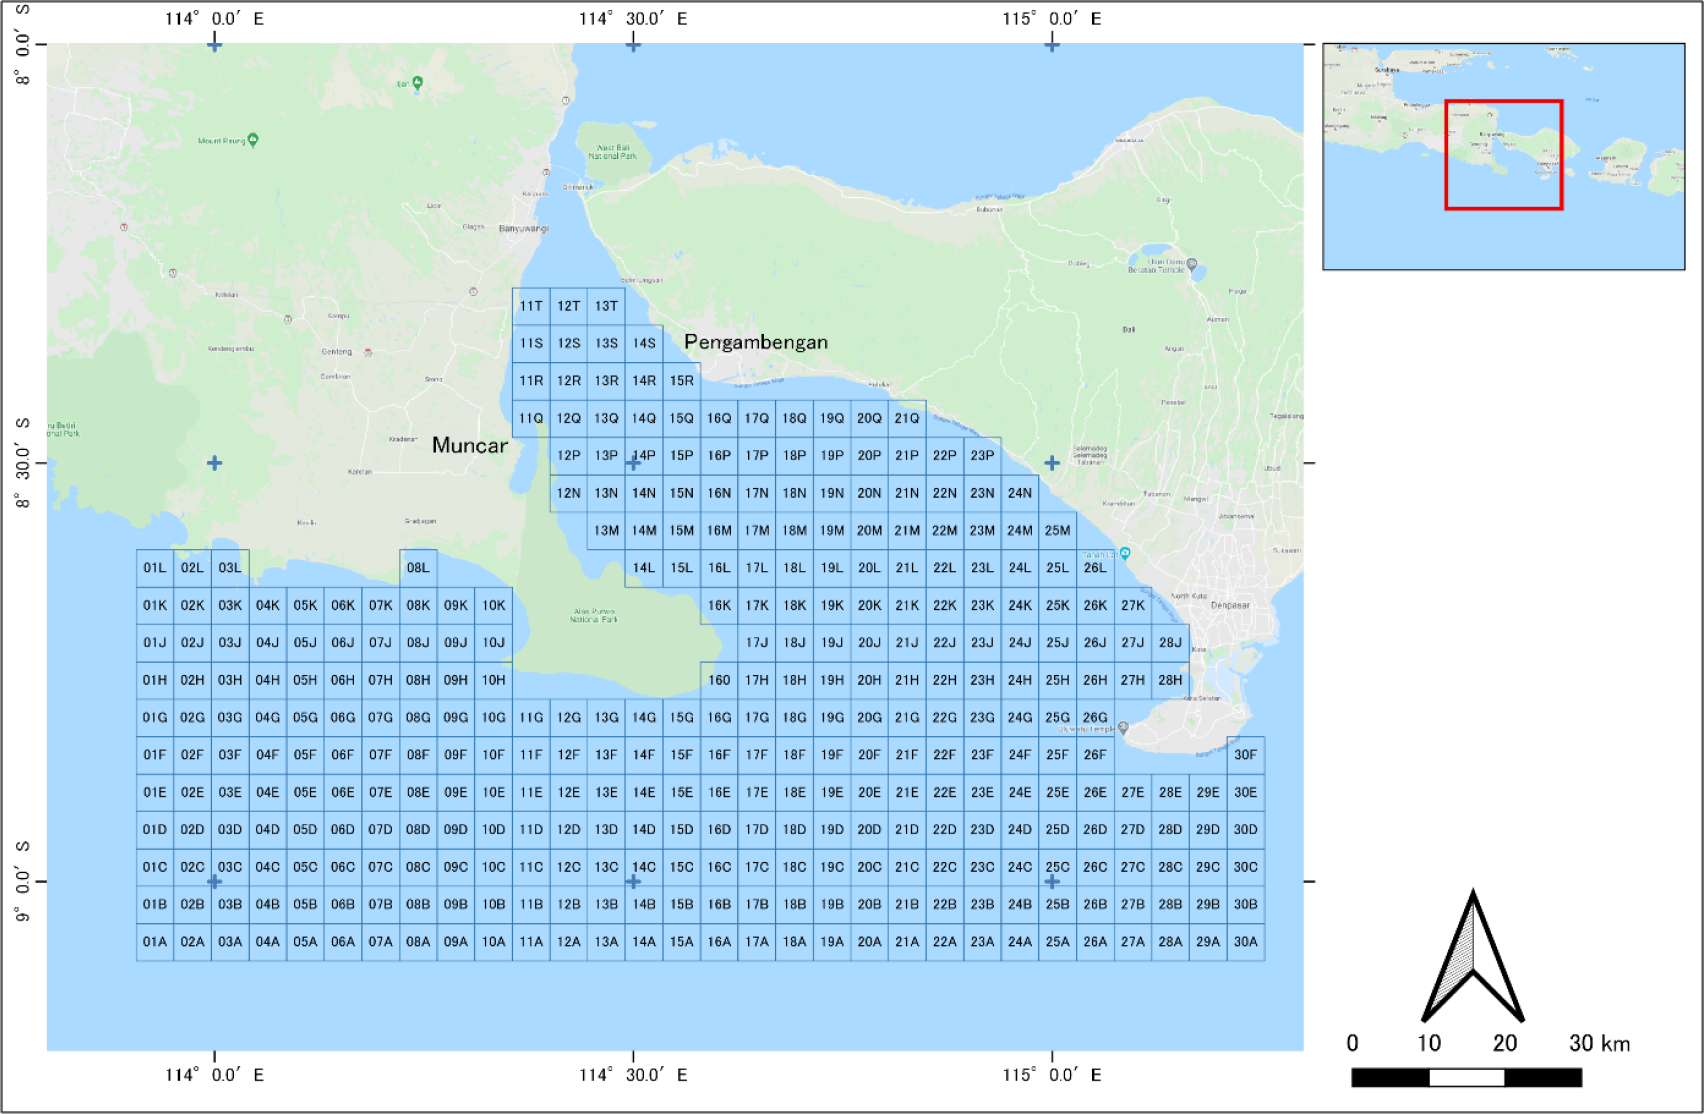
Spatial analysis of the catches and fishing ground position were based on 4 × 4 km size grids developed by IMRO, total 348 grids were coded and assigned. Appendix 2 shows the grid arrangement. Grid code start with the number 01 in the west part and the numbering continue until 30 in the eastern direction. Alphabetic code start with A in the sourthest part and continue until T in the northern direction. The synchronization and statistical calculation (i.e., total catch per grid and number of fishing operations (visits) per grid) were determined using R open source statistical tools. The analysis results were then visualized using QGIS open source GIS software to describe the catch productivity in the Bali Strait [16].
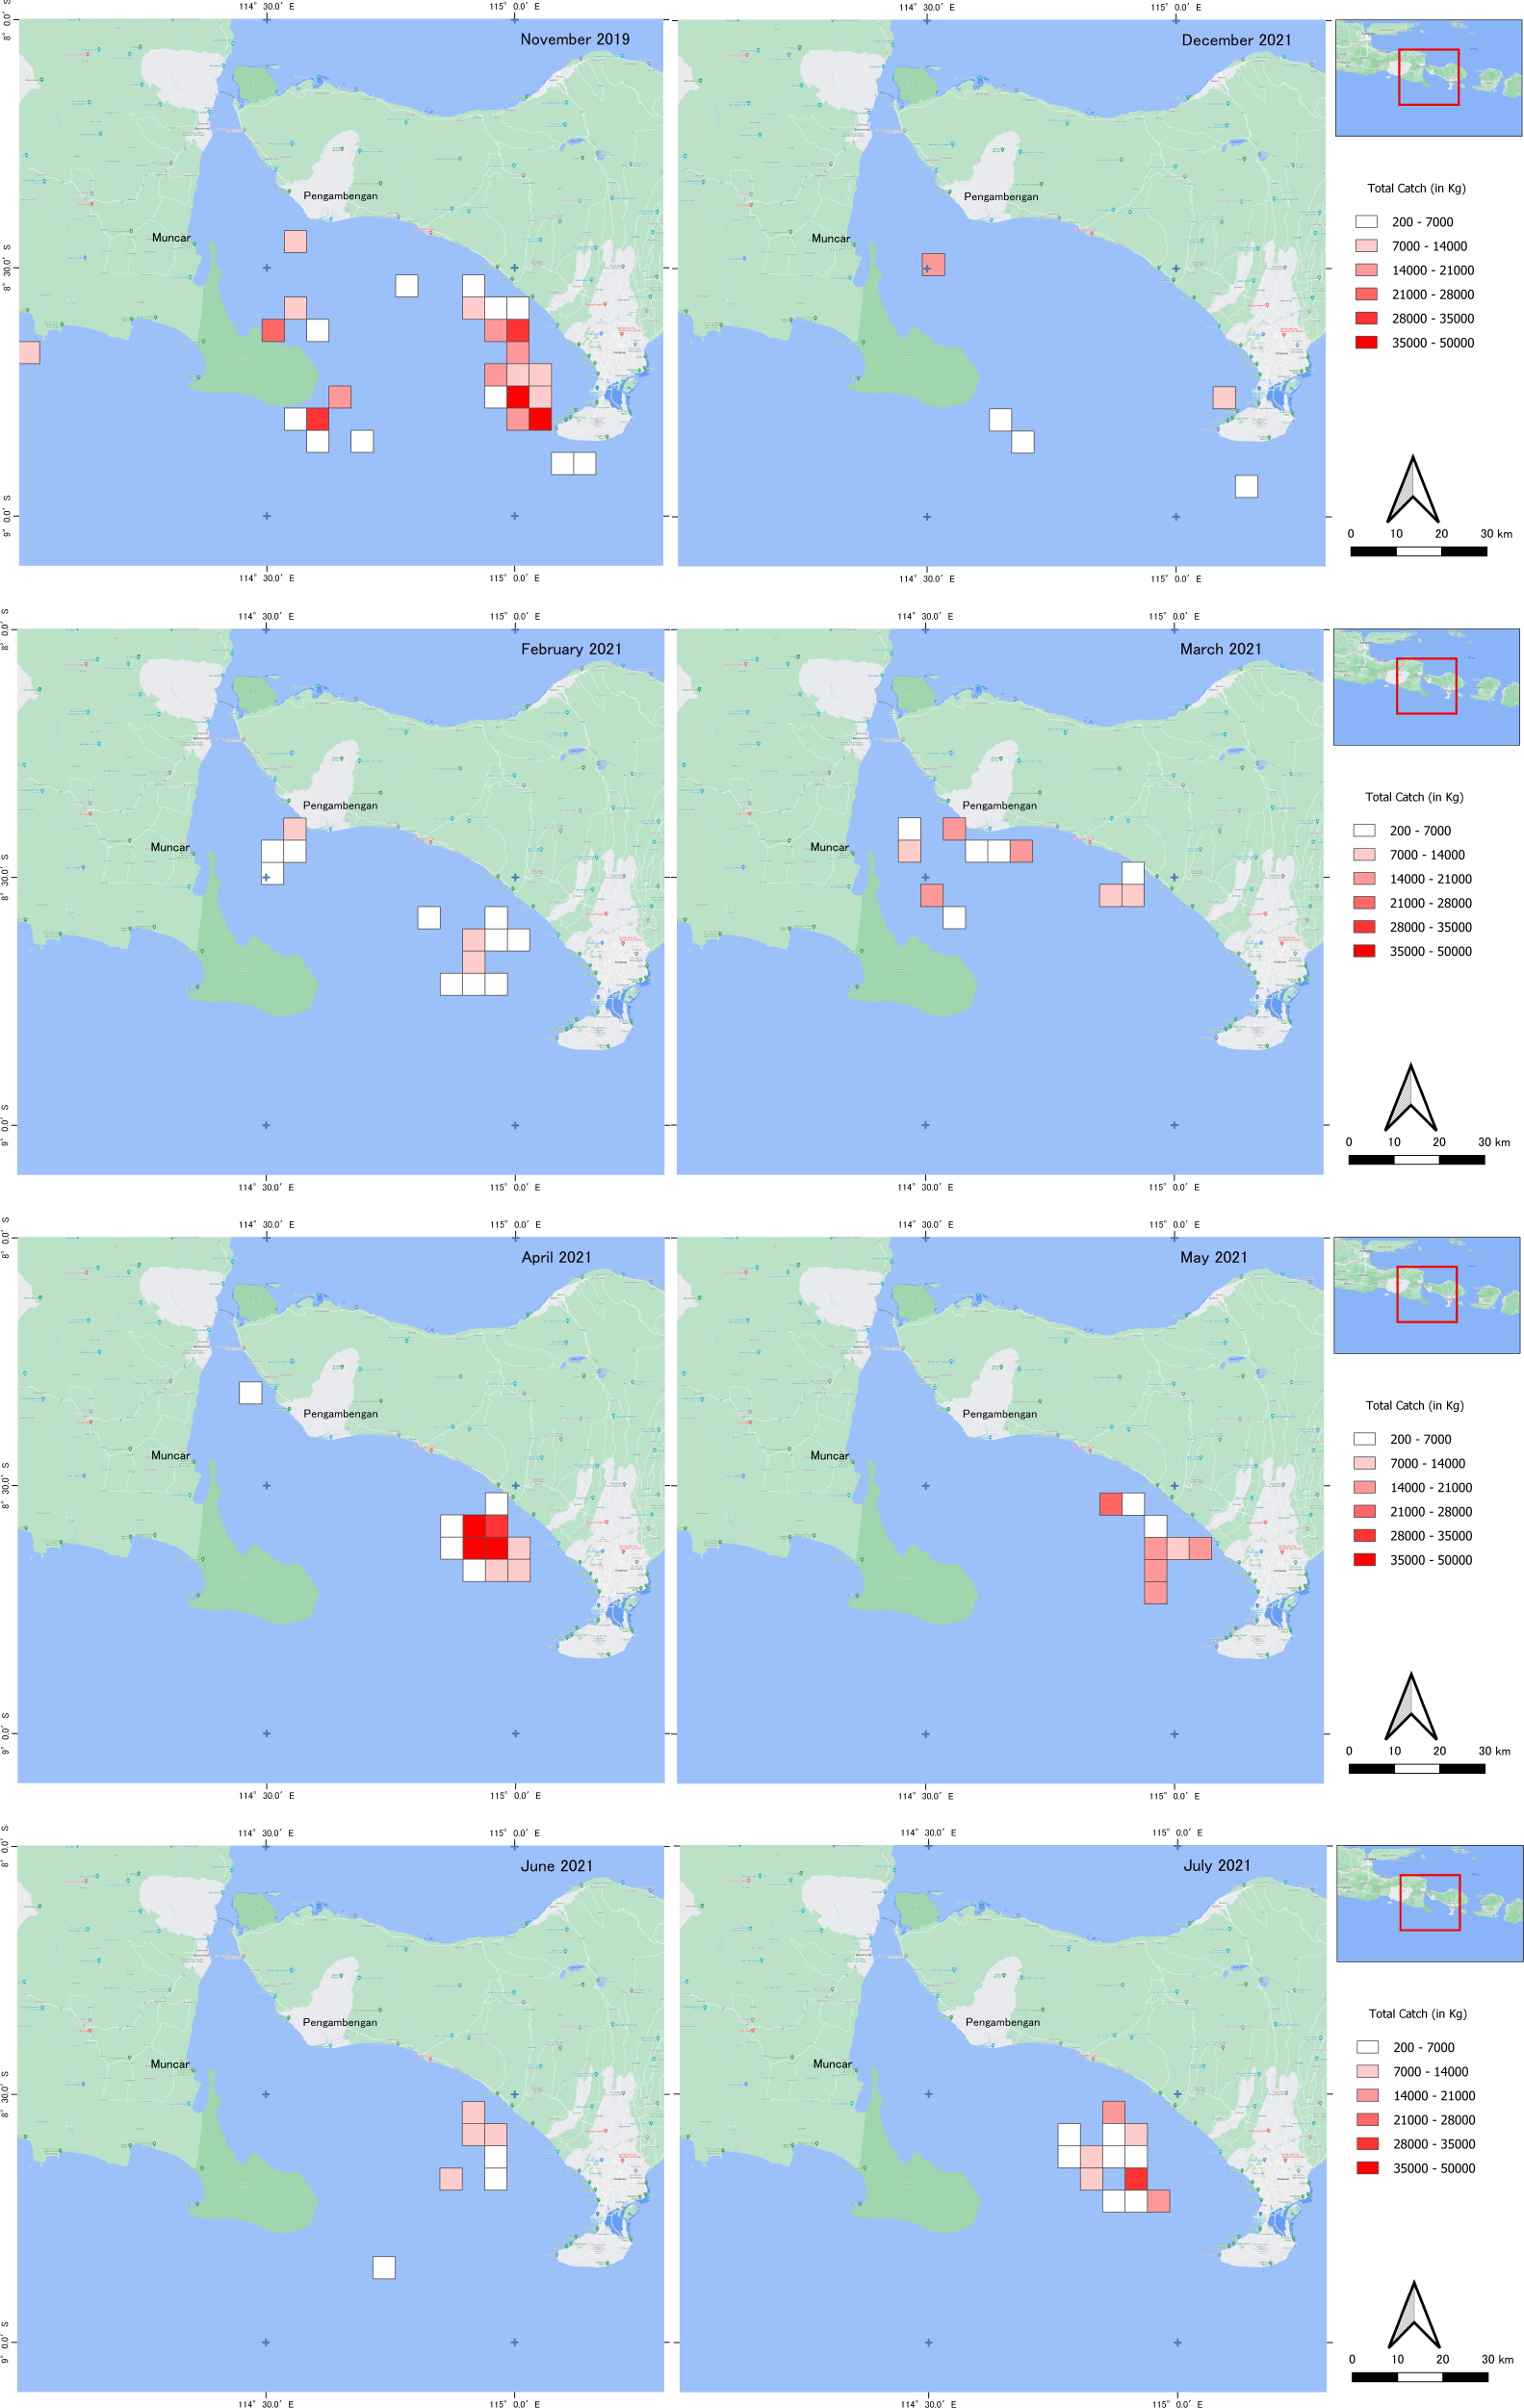
A total of 171 pairs of catch and grid data were obtained from 19,795 landings in the MICT-L database and 641,701 GPS Tracker positions. Figure 7 shows the spatial grid productivity based on the total catch and number of fishing operations in a dedicated grid. Grid 24L in the western part of the Bali Strait near Tabanan Beach had the highest total catch. The total catch in 24L was 90,893 kg, and this grid also had the higher number of fishing operations; fishers often conducted fishing operations in this location to obtain a high catch. The monthly productivity grid in Appendix 3 shows different total catch patterns; in November, grids 25H and 26G showed the highest and second highest total catch, respectively, while in December, grids 14P and 27H had the highest total catch.
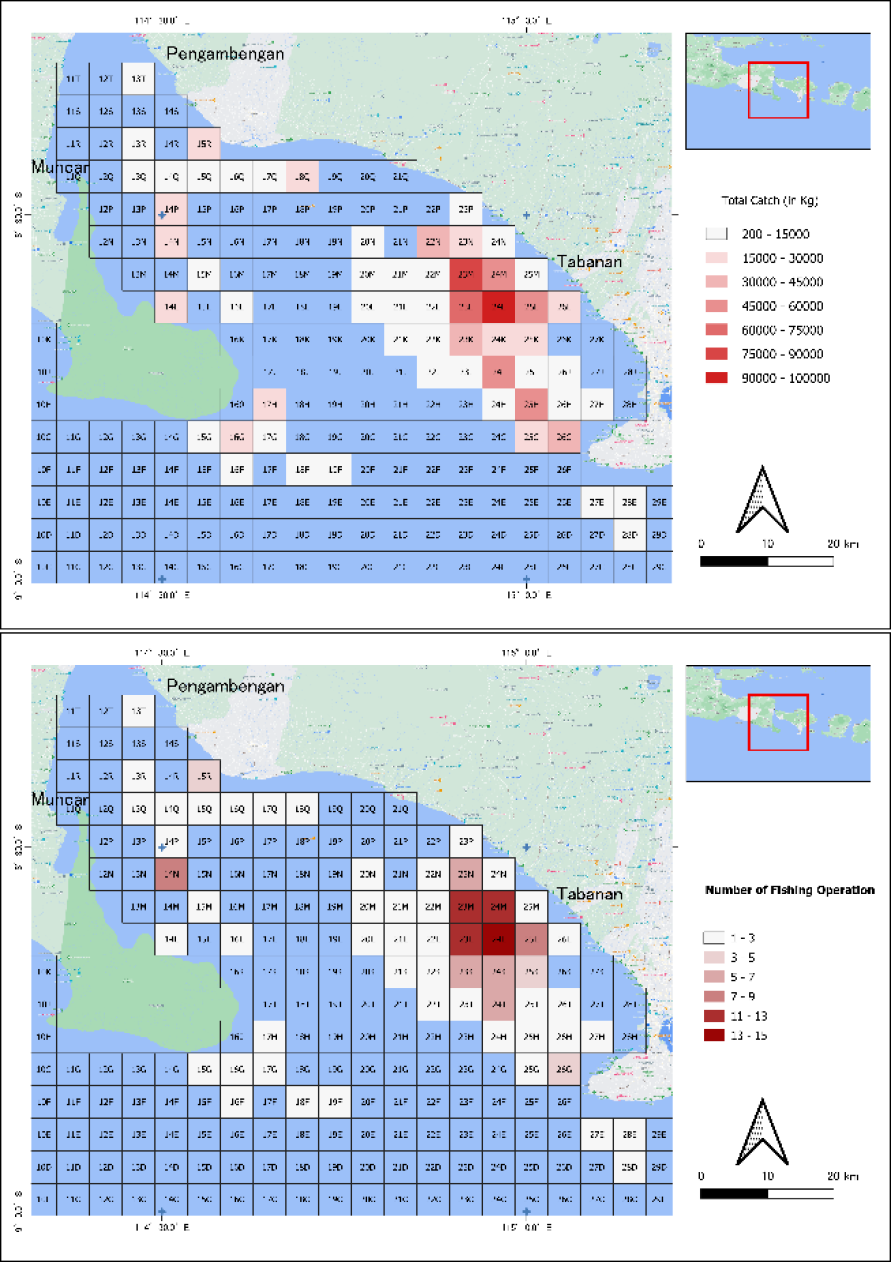
In February, grids 15R and 23K showed the highest total catch, while in March, the highest total catch was observed in grids 18Q and 15R. In April, grids 24L and 23L had the highest total catch. In May, grids 22N and 24L showed the highest total catch. In June, the highest total catch occurred in grids 23M and 22K. In July, grids 23K and 24J showed the highest total catch. This variation can be related to the fishing season and seasonal variability. Spatial grid productivity has been estimated by using chlorophyll and sea surface temperature distributions in previous studies [23] and [24]. However, this grid catch productivity information was considered new information for the Bali Strait fisheries because no study has been capable of obtaining and analyzing grid productivity. Previous studies of the spatial distribution of effort and catch estimation and prediction have used satellite data including surface temperatures, vessel light detection, satellite images, and chlorophyll estimation.
The application of ICT and newly developed database can provide real catch information based on grid locations. This information can be utilized for spatial-based resource management, including permanent and seasonal area closure recommendations, and makes it possible to analyze relationships between environmental conditions, fish distribution, and catch productivity. Furthermore, the analysis can enhance the existing fishing ground prediction and support the fishing efficiencies of the fishers.
4.3 Smart Dashboard
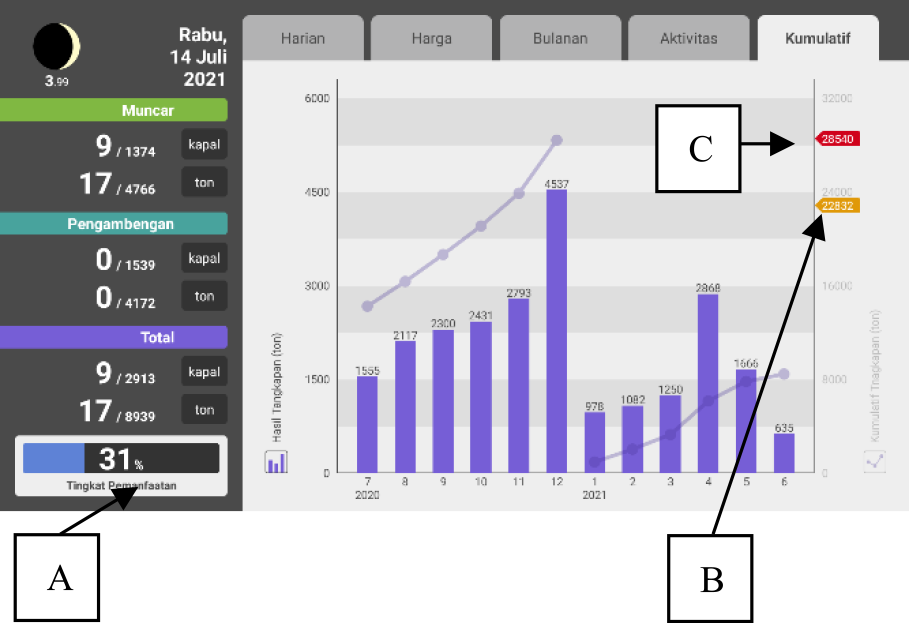
Figure 8 shows the newly developed smart dashboard display. The smart dashboard display consists of five main tabs/menus: daily information, price information by species, monthly catch, daily vessel activities, and cumulative catch information. The beta version (version 1.0) of the smart dashboard display and menus are described in [16]. This study presents the next version of the smart dashboard, with additional information displayed on the menus. Point A in Figure 8 shows the current exploitation level; this information was obtained and analyzed by comparing the cumulative catch to the present time with the TAC level for the current year. Point B shows the yellow line indicating 80% TAC and C shows the red line indicating 100% TAC.
Sustainability in fisheries refers to the healthy maintenance of stock such that fishing activity can be continued as well as the ability of fishers to maintain their livelihood by earning income from their catches. In practical terms, sustainability will be achieved if we extract fish at less than or below the naturally occurring level every year. The estimation of the sustainable harvesting level is displayed on the smart dashboard, enabling managers and fisherman to determine their current exploitation status relative to the limit.
The smart dashboard was successfully developed using information from the databases. This smart dashboard can be a game-changer in sustainable fisheries management by providing important management measures (e.g., TAC and current exploitation level) to stakeholders based on a robust estimation, presented in a simple way that increases understanding.
Although the application of ICT in this study was not yet complete and is limited to a specific location (Bali Strait in Indonesia) and to specific fisheries (i.e., sardine fishery), the system already shows promising results, demonstrating its contribution to sustainable fisheries management. The main benefits of this system are the migration from paper-based data recording to electronic recording and the use of a database platform, thereby improving data validation and verification as well as data quality.
The system also increases the awareness among fishers about the importance of data collection, data analysis, and assessment as well as sustainable fishing practices by disseminating landing monitoring results and indicators via the smart dashboard system. However, fishery performance has not yet improved beacuse the system is not yet fully implemented (especially with respect to policy formulation and implementation).
Fishers and fisheries officers actively participated in the data collection (Figure 9) and were eager to obtain analysis results and visual representations. Some fishers requested the application to track their vessel position using their Android-based smartphone. Stakeholder enthusiasm showed that engagement in the fisheries management process and willingness to participate increased.
Positive results and lesson learned from this study provide good examples and a basis for the implementation of a similar system in other areas and fisheries and for scaling-up the scope of implementation to larger areas and more species of interest.
5. Concluding Remarks
The system developed in this study makes an important contribution to fisheries management. This study successfully demonstrated a complete framework and process for smart fishery development, including the digitalization of data acquisition, the development of a database storage system, data analysis or assessment, and disseminating analysis results to stakeholders by using a simple smart dashboard display. The three main stakeholders of sardine fishery―fisheries managers, fishers, and researchers―can utilize and benefit from the smart fishery system (i.e., to increase awareness and the level of understanding of sustainable fisheries management and to implement management measures at the fisheries).
Future work includes continuous data collection, increasing the data obtained from the GPS Trackers-IoT devices and MICT-L application, analyzing relationships between environmental conditions and the fish distribution and catch productivity, improving fishing ground prediction accuracy using a combination of satellite data and real-time catch productivity, supporting fishing efficiency, and developing support systems for the formulation of capture fisheries policy recommendations.
Acknowledgments The authors would like to extend our gratitude to all collaborators involved in this study. First, we would like to thank the Director of Center for Fisheries Research (CFR) Ibu Yayan Hikmayani, PI of this project Hatim Al Basri Ph.D., the president of Future University Hakodate Prof. Yasuhiro Katagiri, Head of IMRO, Head of Muncar and Pengambengan fishing ports and their support staff, Mr. Subianto, Mr. Winarno, Mr. Windra, Mr. Tono, and Mrs. Gerindri from the Muncar fishing port, and Mr. Razak, Mr. Lukman Hadi, Mr. Angga, and Mr. Made Ageng from the Pengambengan fishing port. Finally, we would like to thank the fishers who participated in this study, Haji Baron, Mr. Sholeh, Mr. Sholihin, Mr. Supari, and Haji Nikmat from Muncar and Mr. Najmuddin, Mr. Otong, Mr. Lonjong, and Mr. Daeng from Pengambengan. This study is a part of the Capture Fisheries Research of SATREPS project entitled “Optimizing Mariculture based on Big Data with Decision Support System,” collaborative research between the governments of Indonesia and Japan, supported by the Ministry of Marine Affairs and Fisheries (MMAF) Indonesia, JICA, and JST Japan.
References
- [1] Andronova, I V., Belova, I N. and Yakimovich, E A.: Advances in Economics, Business and Management Research, Vol.81. 〈https://doi.org/10.2991/mtde-19.2019.53〉 (2019).
- [2] Bull, J. K., Davis, A. W. and Skroch, P. W.: How smart-IT systems are revolutionizing agriculture, The Bridge, Vol.41, No.3, pp.14–21 (2011).
- [3] Byun, Y., Oh, S. and Choi, M.: ICT Agriculture Support System for Chili Pepper Harvesting, Journal of Information Processing Systems ISSN: 2092-805X. Vol.16, No.3, pp.629–638 DOI: 10.3745/JIPS.01.0056 (2020).
- [4] Pardamean, B., Baurley, J. W., Perbangsa, A. S., Utami, D., Rijzaani, H. and Satyawan, D.: Information Technology Infrastructure for Agriculture Genotyping Studies, J Inf Process Syst, Vol.14, No.3, pp.655–665 (2018).
- [5] Fujita, R., Cusack, C., Karasik, R., Takade-Heumacher, H. and Baker, C.: Technologies for improving fisheries monitoring, Environmental Defense Fund, San Francisco, p.71 (2018).
- [6] FAO 2018: The State of World Fisheries and Aquaculture 2018 - Meeting the sustainable development goals, Food and Agriculture Organization of the United Nations (Rome), p.210 (2018).
- [7] Evans D W 2003: FISHERIES DATA QUALITY INDICATORS: review of progress and further approaches to addressing data quality and data cost-effectiveness, FAO (Rome), p.61 (2003).
- [8] Saville, R., Hatanaka, K., Sano, M. and Wada, M.: Ocean & Coastal Management, Vol.106, pp.77–86 (2015).
- [9] FAO 2015: Voluntary Guidelines for Securing Sustainable Small-Scale Fisheries in the Context of Food Security and Poverty Eradication, Food and Agriculture Organization of the United Nations Rome (2015).
- [10] Dowling, N. A., Dichmont, C. M., Haddon, M., Smith, D. C., Smith, A. D. M. and Sainsbury, K.: Guidelines for developing formal harvest strategies for data-poor species and fisheries, Fisheries Research, Vol.171, pp.130–140 (2015).
- [11] Ministry of Marine Affairs and Fisheries, Ministerial Decree No.68/2016: Concerning Sardine Fisheries Management Plan in Indonesia Fisheries Management Area (WPPNRI), Jakarta, p.55 (2016).
- [12] Gunnlaugsson, S. B. and Kristofersson, D. M.: Resource Rent and is Distribution in Iceland's Fisheries, Marine Resource Economics, Vol.35, No.2 (2020). 〈https://doi.org/10.1086/708507〉.
- [13] Arland, K. and Bjorndal, T.: Fisheries management in Norway - an overview, Marine Policy, Vol.26 pp.307–313 (2002).
- [14] Gullestad, P., Abotnes, A. M., Bakke, G., Mauritzen, M. S., Nedreaas, K. and Søvik, G.: Towards ecosystem-based fisheries management in Norway - Practical tools for keeping track of relevant issues and prioritising management efforts, Marine Policy, Vol.77 pp.104–110 (2017).
- [15] Boenisha, R., Willard, D., Kritzera, J. P. and Reardon, K.: Fisheries monitoring: Perspectives from the United States, Aquaculture and Fisheries, Vol.5 pp.131–138 (2020).
- [16] Natsir, M., Waryanto and Wada, M.: An attempt of digitalization Bali Strait purse seine capture fisheries data, IOP Conf. Series: Earth and Environmental Science, Vol.674, p.012066 〈https://doi.org/10.1088/1755-1315/674/1/012066〉 (2021).
- [17] Natsir, M., Anggawangsa, R. and Wada, M.: Assessing Bali sardine stock status using real-time electronic catch landing data recorder and time series catch database, IOP Conf. Series: Earth and Environmental Science, Vol.744, p.012048 〈https://doi.org/10.1088/1755-1315/744/1/012048〉 (2021).
- [18] Sari, Y D., Koeshendrajana, S., Nababan, B O.: Sos. Ekon. J. Kelaut. dan Perikan., Vol.4, No.1, pp.1–12 (2009).
- [19] Zulbainarni, N.: Multispecies Exploitation Bio-economic Model in Bali Strait Waters, Dissertation of IPB University Graduated School (Bogor). p.280 (2011).
- [20] Anonymous: Muncar fishing port statistical annual report (2010–2019).
- [21] Anonymous: Pengambengan fishing port statistical annual report (2010–2019).
- [22] Prager, M H.: User's Guide for ASPIC Suite, version 7: A Stock-Production Model Incorporating Covariates and auxiliary programs, (Oregon, USA: Prager Consulting Portland) (2016).
- [23] Pertami, N D. et al.: IOP Conf. Ser.: Earth Environ. Sci., Vol.278, p.012058 (2019).
- [24] Syah, A. F., Setyowati, N. and Susilo, E.: Preliminary Findings on Distribution of Bali Sardinella (Sardinella lemuru) in Relation to Oceanographic Conditions during Southeast Monsoon in Bali Strait Using Remotely Sensed Data, Journal of Marine Science, Vol.01, No.01, pp.25–30 (2019).
Appendix

Mohamad Natsir g3119009@fun.ac.jp
Mohamad Natsir received his B.S. from Bogor Agricultural University, Indonesia, in 2001 and his M.S. from Bogor Agricultural University in 2010. From 2002 to 2010, he was a research associate at the Research Institute for Marine Fisheries, Indonesia. Beginning in 2010, he was a full-time researcher at the Research Institute for Marine Fisheries and moved to the Center for Fisheries Research (CFR) in 2012. Since 2019, he has been a senior researcher and is currently enrolled as a PhD student in the School of System Information Science, Future University Hakodate, Hokkaido, Japan. His research interests are small-scale fisheries, capture fisheries data improvement and analysis, and the application of ICT to fisheries management (email address: g3119009@fun.ac.jp and natsir@kkp.gp.id). He is a member of the IEEE and Indonesian Researcher Union (HIMPENINDO).

Romy Ardianto
Romy Ardianto is a data scientist at the Institute for Marine Research and Observation. He earned his Master's degree in Computer Science and Decision Systems from TELECOM Bretagne, France. His research interests include big data, artificial intelligence, machine learning, business intelligence, predictive analytics, and data mining. He has been involved in big data and artificial intelligence projects for satellite applications in the maritime sector.
Reny Puspasari
Reny Puspasari is a senior researcher at the Center for Fisheries Research, Ministry of Marine Affairs and Fisheries. She completed a Doctoral degree from IPB University majoring in Aquatic Resources Management focusing on marine ecology and ecosystem dynamics. Her research interest is the interaction between environmental factors and fish resources, including the effects of anthropogenic and environmental stressors on fish resources.

Masaaki Wada
Masaaki Wada received his B.S. from Hokkaido University in 1993 and his Ph.D. degree from the Graduate School of Fisheries Sciences, Hokkaido University in 2004. From 1993 to 2004, he worked as an engineer at Towa Denki Seisakusho, Japan. In 2005, he moved to Future University Hakodate, Japan. From 2005 to 2011, he was an associate professor, and since 2012, he has been a professor. His research field is smart fisheries toward sustainable fisheries in Japan and the Southeast Asia region. He is a member of IPSJ, IEICE, and IEEE.
再受付日 2021年11月11日
採録日 2021年12月14日
会員登録・お問い合わせはこちら
会員種別ごとに入会方法やサービスが異なりますので、該当する会員項目を参照してください。