Performance Evaluation of High Availability Database Systems Using Low-latency I/O Devices
1. Introduction
There are now low-latency I/O devices whose access time is on the order of 10 µs. These low-latency I/O devices affect the computer system architecture because current computer systems have been designed based on I/O devices whose access time is O(ms) [1].
I/O devices have evolved from a hard disk drive (HDD) to a solid-state drive (SSD) that uses NAND MLC flash memory, and the I/O access time has been reduced from O(ms) to O(100 µs). These technological innovations have improved the performance of the database system. Recently, a new type of low-latency SSD has become available that uses 3D XPointTM memory technology or ZNAND technology. By using these technologies, the latency of I/O devices has been reduced to O(10 µs) [2]-[4].
These I/O devices use the nonvolatile memory express (NVMe) interface, which is designed for flash memory (i.e., non-volatile memory) SSDs. NVMe devices are accessed via the peripheral component interconnect express (PCIe) bus, so they connect directly to a server via a PCIe slot or 2.5 inch U.2 drive bay [5].
Database systems are used in mission critical systems, and most database systems are designed as fault-tolerant configurations. A typical configuration of a mission-critical database is a high-availability configuration (HA). This configuration consists of two database servers and an external shared storage system. If one database server fails during operation, the workload of the failed server is switched over to another database server. The external shared storage has its own fault-tolerant features, such as RAID systems, so that the system has no single-point-of-failure [6].
Most of the existing studies on NVMe SSD evaluate their proposals by using a single database server, because NVMe SSD is connected to a server via PCIe bus [7]-[9]. Some researchers have proposed a data replication method for an NVM database system, but these studies focused on optimizing the data transfer volume by using the log shipping method [10], [11].
In this study, to ensure the redundancy of the database system, we proposed a simple architecture with data replication. We evaluated an HA database system that configured two servers with NVMe SSDs connected to the servers. In our configuration, each write I/O to the NVMe SSD was replicated simultaneously between the servers for redundancy. Therefore, the write I/O latency is the sum of local write I/O latency and remote write I/O latency. Therefore, remote write I/O latency is a critical issue in our configuration. To implement remote write I/O with low latency, we used the “NVMe over Fabrics” protocol. The NVMe over Fabrics protocol provides low-latency remote I/O by using RDMA over converged Ethernet [12]. The overhead of the NVMe over Fabrics protocol was reported to be 11.7 µs in [13]. In our hardware configuration using 100 GbE network adapters and a 100 GbE switch, the protocol overhead was 10–20 µs. The remote write I/O latency is the total overhead of NVMe over fabrics and the write I/O latency at the remote server. In our hardware configuration, it was 20–30 µs. In this way, we configured an HA database system to realize a low-latency remote I/O.
We evaluated the performance of high availability database systems using two benchmarks: a primitive workload benchmark and a TPC-C-based benchmark [14]. The primitive workload benchmark was designed to measure the basic database performance, and it consisted of single-row select or update operations. The TPC-C-based benchmark, which is equivalent to HammerDB, measured the database performance of a typical online transaction system [15]. We refer to this TPC-C-based benchmark as the mixed workload benchmark in this study. The details of the benchmarks we use are described in Section 4.
Before evaluating these workloads, we estimated relative performance based on I/O latency compared to a system whose data is cached in memory in Section 3. This indicates that it is effective to apply low-latency I/O devices with an access time of O(10 µs) to the application whose CPU time between I/O operations is O(100 µs).
To confirm this estimate, we evaluate a single-database system using mid-latency and low-latency SSDs with I/O latencies of O(100 µs) and O(10 µs), respectively. We also evaluate the performance overhead of a high-availability configuration using a primitive workload. Finally, we evaluate three different high-availability database configurations using low-latency SSDs, mid-latency SSDs, and external storage.
After introducing related work in Section 2, we discuss the effective target of low-latency I/O devices based on the discussion in Section 3. In Section 4, we describe the system configurations and workloads, in Section 5 we show the performance evaluation results, and in Section 6, we conclude the paper.
2. Related Work
The advent of the NVMe SSD has had a significant impact on system architecture, especially for I/O-intensive software. Xu et al. [7] evaluated MySQL, Cassandra, and MongoDB using SATA-SSD and NVMe-SSD. Using a HammerDB as a benchmark, the performance of a single NVMe SSD configuration improved by 3.5 times compared to a single SATA-SSD configuration. Coburn et al. [8] proposed Editable Atomic Writes for logging that was optimized for NVMe SSDs. By implementing a transaction control logic in the SSD controller, a 3.7 times better performance was achieved. Renen et al. [9] proposed a 3-tier database buffer management system consisting of DRAM, NVM, and SSD. To use NVM efficiently, they introduced a mini page that knows the cache line of the processors. These proposals are promising, but they are focused on improving the performance of a single database server. Moreover, they were evaluated without the HA configuration.
Some studies proposed a data replication method for an NVM database system [10], [11]. However, these studies focused on optimizing data transfer by using log shipping because the network cost is the major performance bottleneck of data replication.
To reduce the network latency for data replication, the NVMe over Fabrics protocol is a promising technology. Guz et al. [13] applied this protocol to the storage disaggregation method. They showed that there is no significant difference between local and remote storages when using NVMe over Fabrics protocol for storage disaggregation, but they did not apply it to data replication.
3. Effective Target Area of Low-latency I/O Devices
The NVMe interface was designed for SSDs with non-volatile memory and is standardized worldwide by NVM Express, Inc., which consists of dozens of industrial members. NVMe is suitable for low-latency, high-bandwidth I/O devices because it connects directly to a PCIe bus. NAND MLC flash type SSDs (NAND SSD) have gradually supported the NVMe interface in addition to the traditional SAS/SATA interface. The typical latency of NVMe NAND SSDs is O(100 µs), which is ten times faster than that of conventional HDDs.
In addition to NAND technology, there are new types of low-latency SSDs, such as 3D XPointTM Memory technology and ZNAND technology. With these technologies, the latency of I/O devices becomes O(10 µs).
Figure 1 shows a relative performance estimate by I/O latency compared to a system where all data is cached in memory. The horizontal axis indicates the average CPU time between I/O access to data, and the vertical axis indicates the relative performance compared to all data cached in memory. The relative performance of memory access is estimated as follows:
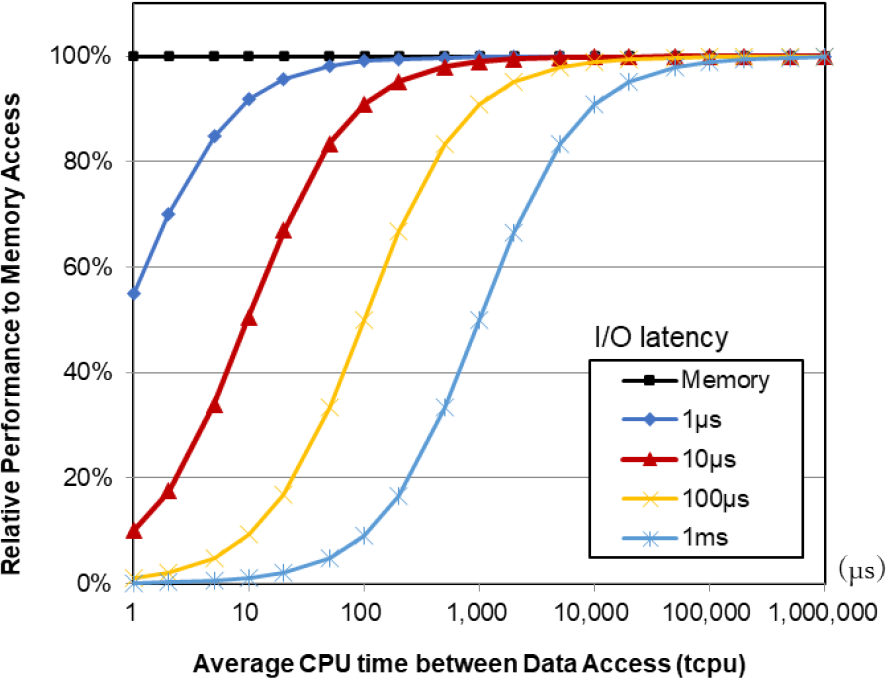
(tcpu + tmem) / (tcpu + tio)
where tcpu is the CPU time between I/O access to data, tmem is the latency of memory access, and tio is the latency of I/O access to data. We calculated the latency of memory access tmem as 0.1 µs. If the average CPU time between I/O accesses is 100 µs and the average I/O latency is 100 µs, the relative performance to memory access is estimated as follows:
(100 µs + 0.1 µs) / (100 µs + 100 µs) = 50%.
This estimation result indicates that the I/O overhead is still significant even if we use O(100 µs) latency SSDs, such as typical NAND NVMe SSDs. Alternatively, if we apply a 10 µs latency I/O device, the relative performance to memory access is estimated as follows:
(100 µs + 0.1 µs) / (100 µs + 10 µs) = 91%.
This means that system performance can reach more than 90% when using low-latency I/O devices if the average CPU time between I/Os is 100 µs. Consequently, using low-latency I/O devices with an access time of O(10 µs) is effective for the application when CPU time between I/O is O(100 µs).
Note that this estimate does not consider task switching to utilize the CPU and I/O more efficiently. Therefore, the relative performance would improve in cases of I/O latency greater than 100 µs. However, task switching for low-latency I/O devices is not effective because the task switching overhead is 20–30 µs, which is equal to or longer than I/O latency when access time is O(10 µs).
Based on the above estimation, we use the Intel® OptaneTM DC SSD as a low-latency I/O device with access times of O(10 µs) or NAND NVMe SSD as a mid-latency I/O device with access times of O(100 µs).
This estimate is the result of desk evaluation, and the evaluation model is simplified to I/O latency and CPU time between accesses. It does not consider the overhead of exclusive processing for database processing. In the exclusive processing of DB, it is common for the process that after trying to obtain a lock through a certain number of polls, it sleeps for a certain period of time if it cannot obtain the lock. The number of polls and the sleep time were tuned to match the characteristics of conventional I/O devices. For example, in the case of the database system used for evaluation, the sleep time was tuned as 1 ms based on I/O devices with a latency of O(100 µs).
We tuned the parameters related to exclusive processing to O(10 µs) to match the characteristics of low-latency I/O devices.
4. High Availability Database System
4.1 Server Configurations
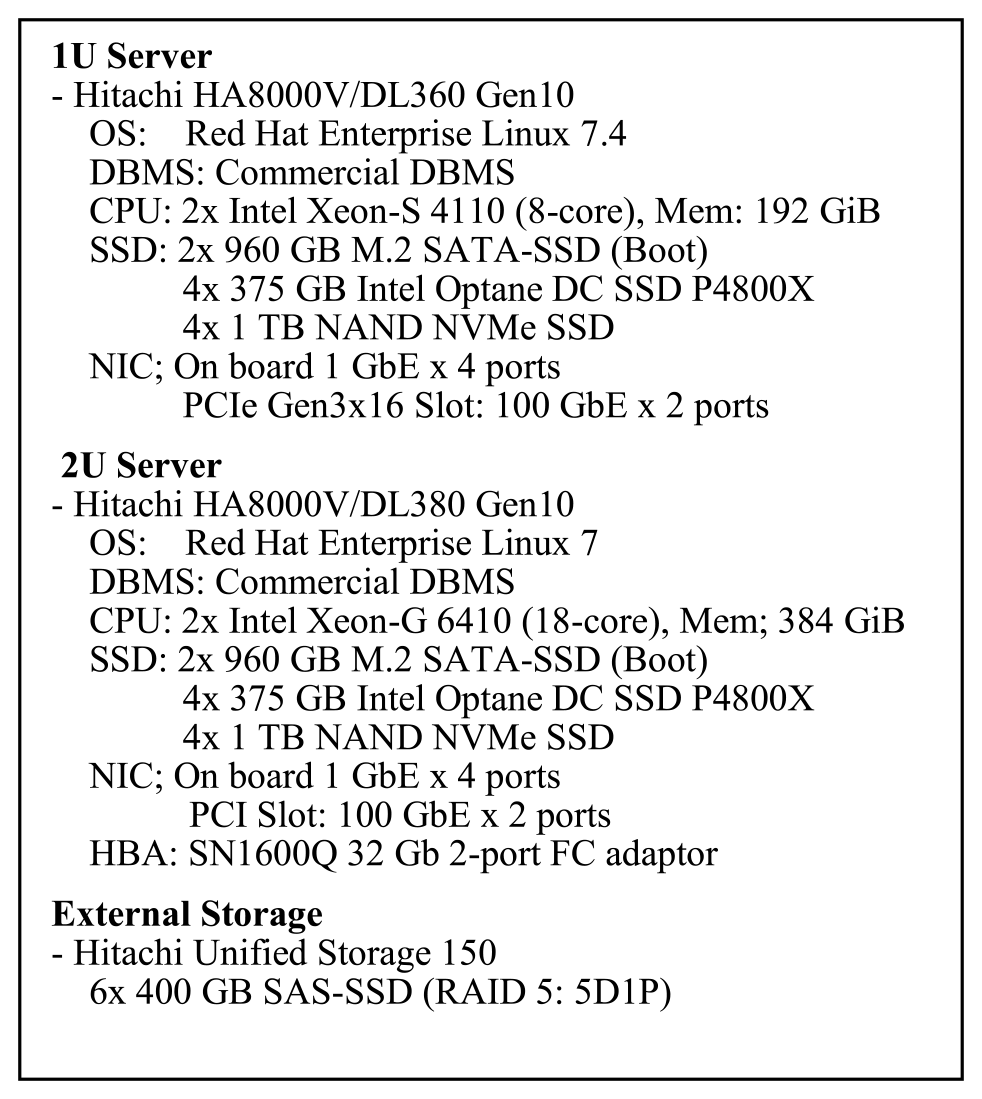
Figure 2 describes the servers that were used for the performance evaluation. The 1U server was used to evaluate the primitive workload benchmark, and a 2U server was used to evaluate the mixed workload benchmark. The details of these workloads are described in Section 3.3. To evaluate the effect of low-latency I/O devices, we installed four low-latency and four mid-latency I/O devices on each server. For the HA configuration, we used a 100 GbE network to connect the database servers as the total write throughput of the four NVMe SSDs is approximately 8 GB/s. To compare a conventional high availability database system with external storage, we installed a host bus adaptor (HBA) in 2U servers. We installed Red Hat Enterprise Linux 7.4 and a commercial DBMS.
4.2 System Configuration
Figure 3 shows the configuration of the system. A single server configuration used to evaluate the baseline performance of the database system using NVMe SSDs. In our evaluation, we cached all indexes in the database buffer, while we allocated a DB buffer of 1–100% for the tables. With a buffer size of 1%, almost all table accesses missed the DB buffer. In this configuration, we evaluated both low-latency and mid-latency I/O devices to confirm the effect of low-latency I/O devices.
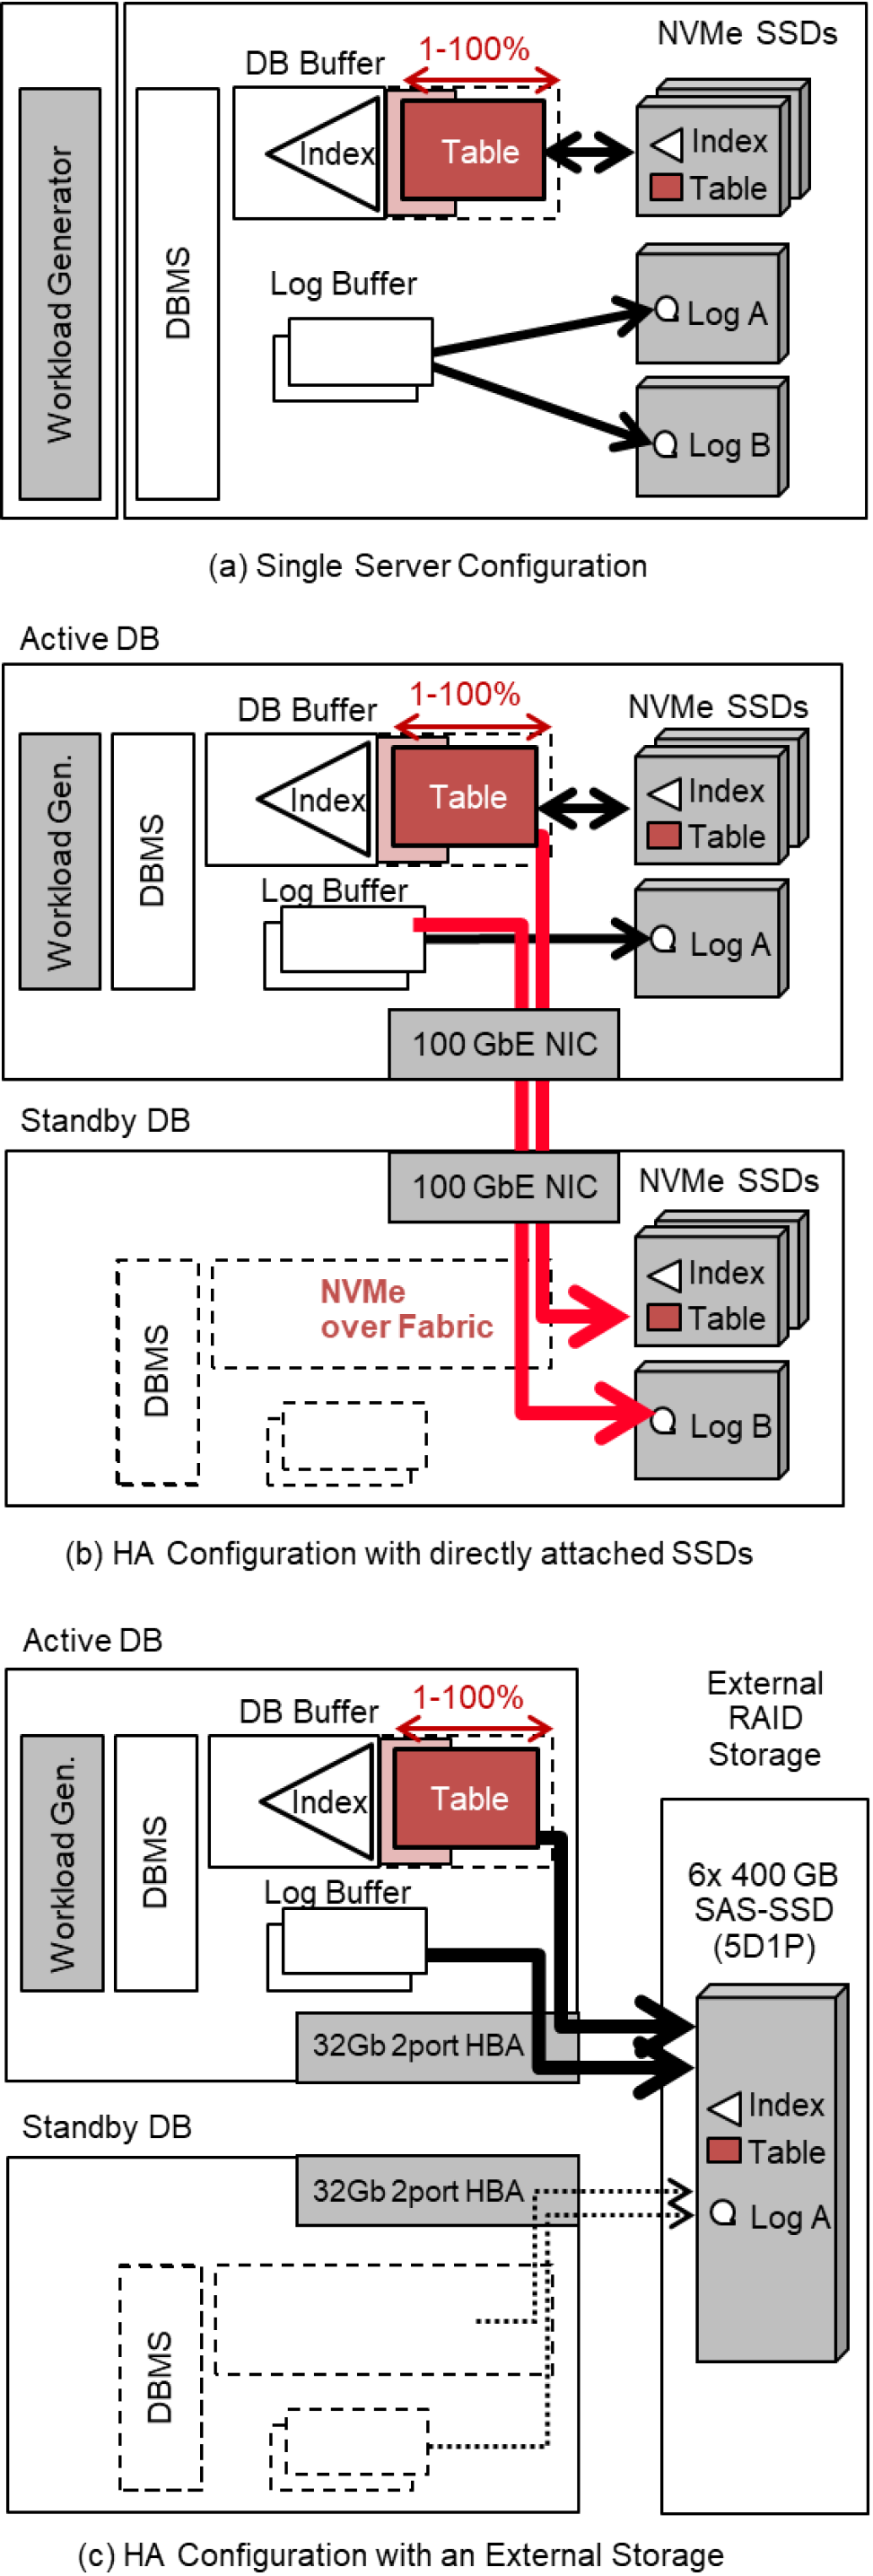
Figure 3 (b) and (c) show the HA configurations consisting of one active and one standby DB. Figure 3 (b) uses directly connected NVMe SSDs to store the data. All write data are synchronously duplicated to the standby DB by using the NVMe over Fabrics protocol via 100 GbE network. Figure 3 (c) shows a conventional HA configuration with external storage. In our evaluation, we used RAID 5 storage configured with six SAS SSDs. Because data redundancy is ensured by the RAID storage system, no data are duplicated in the database system.
4.3 Benchmarks for Evaluation
(1) Primitive workload
Figure 4 shows the workload for evaluating primitive database operations, that is, selecting and updating single-row transactions. We created ten tables consisting of SID (integer), C1 (integer), and Data1 (char(4096)). SID is the primary key of the table, and each table has a B-tree index of SID. The page size of the index and the table is 4 KiB and 24 KiB, respectively. Each table has 500 thousand rows, so the total number of rows for 10 tables is 5 million. The physical sizes of the index and table were 155 MiB and 24 GiB, respectively. In our experiments, we cached all the index data in the database buffer, while we cached 1% (240 MiB) to 100% (24 GiB) of the table data in the database buffer.
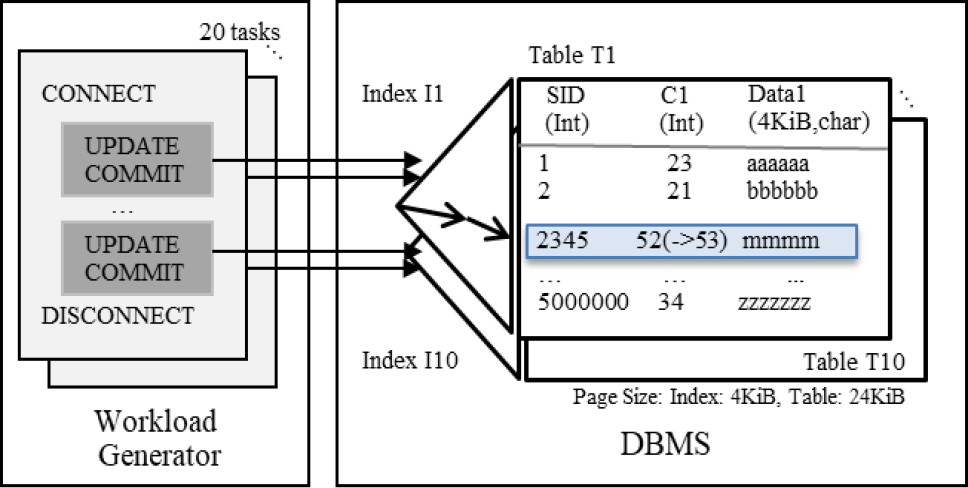
The workload generator consists of multiple tasks that execute multiple transactions simultaneously. We evaluated select operations and the update operations separately. For select operations, all workload tasks select a single row using a randomly generated primary key and then commit. For update operations, all workload tasks execute single row updates of the C1 column by using a randomly generated primary key and then perform a commit. The I/O access patterns for each transaction are as follows:
- ・Select Transaction: A data page is read if the DB buffer misses. No log is written.
- ・Update Transaction: In the case of a DB buffer miss, a dirty page is written back, and then a data page is read. Update logs are written during the commit.
(2) Mixed workloads
The mixed workload was designed based on the TPC-C benchmark. We changed the think time of the TPC-C benchmark to zero. Similar to the Hammer DB, which was designed based on the TPC-C benchmark, each task executes equivalent SQLs to the TPC-C benchmark, but each client task issues the next SQL without any interval time. Instead of using 1U servers with 8-core CPUs, we used 2U-servers with 18-core CPUs, so we evaluated 30 client tasks. The number of warehouses we used was 800, totaling 400 million rows. We created B-tree indexes for each table on the primary key and some foreign keys. The physical size of the index and table was 9.6 GB and 74 GB, respectively. We cached all index data in the database buffer, while we cached 5–100% (3.7–74 GB) of the table data in the database buffer.
4.4 Test Cases for Evaluation
Table 1 presents the test cases for database performance evaluation. Case A evaluates a single database system using mid-latency and low-latency SSDs with I/O latencies of O(100 µs) and O(10 µs) respectively, to confirm the estimation described in Section 2. Case B evaluates the performance overhead of the high-availability configuration by comparing configurations #1 and #3. For the evaluations of Case A and B, we used the primitive workload.
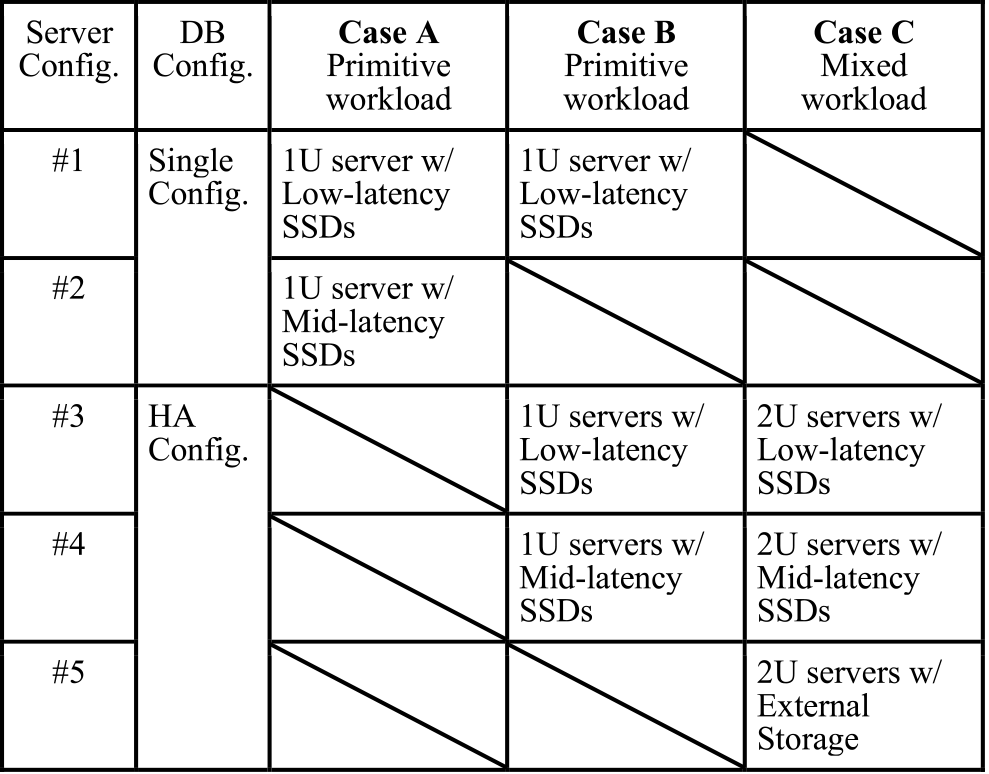
Case C evaluates a more practical system and workload. We evaluated three different types of high-availability database configurations using low-latency SSDs, mid-latency SSDs, and external storage. We executed a mixed workload based on the TPC-C benchmark.
5. Performance Evaluation Results
5.1 Case A
Case A evaluates the effectiveness of low-latency I/O devices for a single-database configuration. Figure 5 shows the results of the SELECT and UPDATE transactions. The horizontal axis shows the relative DB buffer size compared to the table size, and the vertical axis shows the total throughput of the transaction.
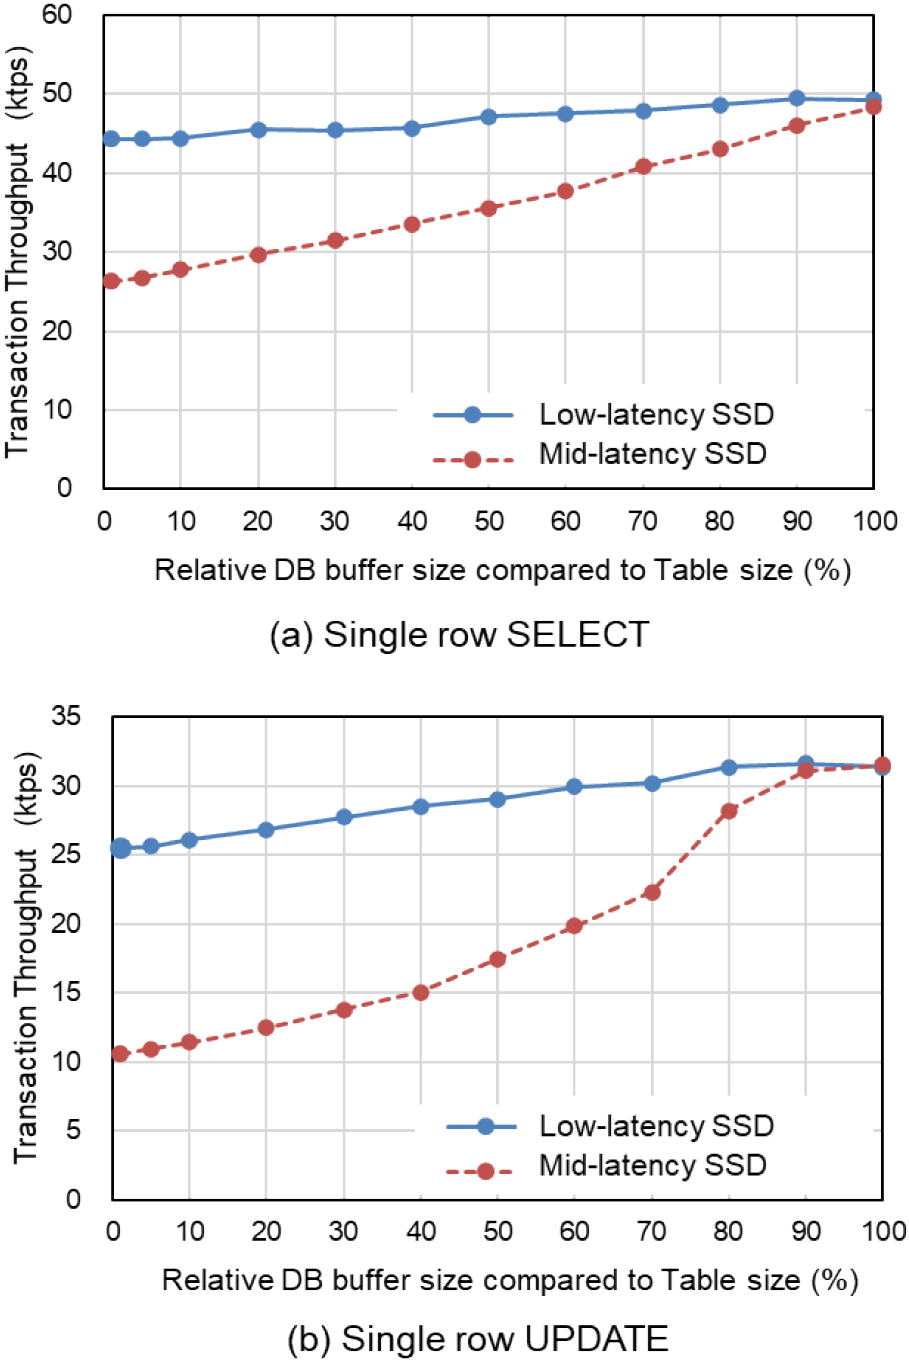
In the case of a 100% buffer size, all data are cached in memory. Therefore, the throughput is almost the same for both low-latency and mid-latency SSD configurations. With a buffer size of 1%, 99% of the transactions miss the database buffer, and I/O access to the data occurs. For SELECT transactions, a data page is read from the I/O devices; and for UPDATE operations, a dirty page is written back and then a data page is read from the I/O devices, and update logs are written on commit.
The transaction throughput gradually decreases when the DB buffer size is decreased. Figure 5(a) shows the performance of SELECT transactions. The performance at 1% buffer size is 90% compared to 100% buffer size for low-latency SSD, but for mid-latency SSDs, the performance at 1% buffer size decreases to 54% compared to the 100% buffer size case. Figure 5(b) shows the performance of UPDATE transactions. The performance of the 1% buffer size is 78% compared to the 100% buffer size for low-latency SSDs, but in the case of mid-latency SSDs, the performance decreases to 34% compared to the 100% buffer size case.
In the evaluation of case A, the SELECT performance of low-latency SSDs was 1.7 times larger than that of mid-latency SSDs, and the UPDATE performance of low-latency SSDs was 2.3 times larger.
This result confirms the relative performance estimation by I/O latency in Section 2. Because the CPU time between I/O operations was 100–150 µs and I/O latency was 20–30 µs in the configuration of low-latency SSDs, the relative performance was estimated as 80–90% (Fig. 1). The performance of the mid-latency SSDs also matched the estimate in Fig. 1.
5.2 Case B
Case B evaluates the overhead of the HA configuration, that is, the overhead of synchronous data replication. As explained in Section 3.4, we evaluated a single configuration with low-latency SSDs, HA configuration with low-latency SSDs, and HA configuration with mid-latency SSDs. In the HA configuration, two servers are connected using a 100 Gb ethernet. We duplicate data and log by using NVMe over Fabrics (NVMe-oF) protocol, which uses the RDMA protocol that reduces the overhead of remote data access. Both data and log are duplicated synchronously, so there is no data loss if the active server fails. Because the SELECT transaction does not perform any write access to I/O devices, there is no performance difference between the single configuration and the HA configuration. Therefore, we evaluated these configurations by using a single row update transaction, which is the same as the primitive workload.
Figure 6 shows the results for Case B. The vertical axis shows the transaction throughput, and the horizontal axis shows the relative DB buffer size. The performance of HA configurations in the case of 100% buffer size is 88% compared to a single configuration. Because there is access to data page access when the buffer size is 100%, the overhead of log duplication via NVMe-oF is 12%. The performance of HA configurations using low-latency SSDs and mid-latency SSDs was almost the same because the same amount of log was duplicated via NVMe-oF.
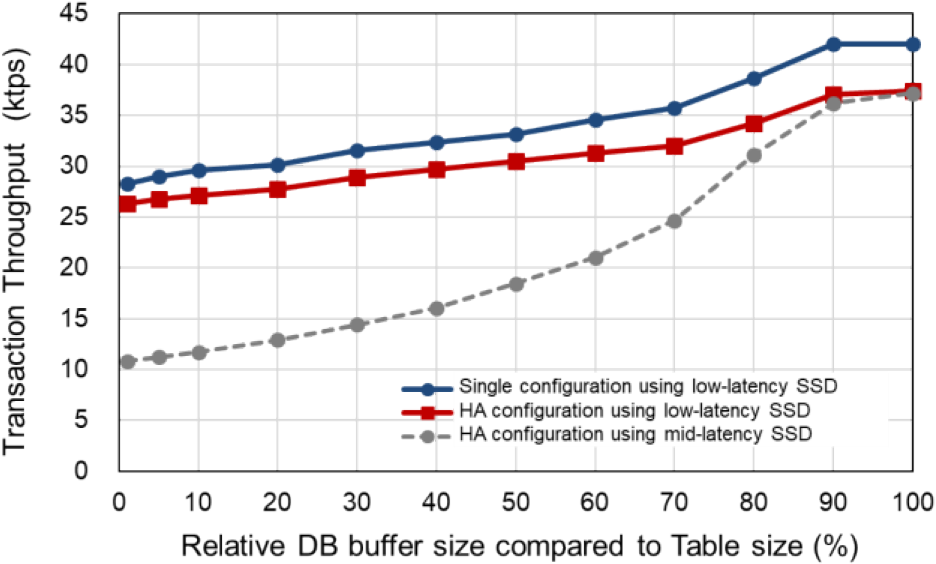
With a buffer size of 1%, the performance of the HA configuration using low-latency SSDs is 93% compared to the performance of a single configuration. The relative performance ratio is higher than when the buffer size is 100%, because the data pages are read from the local SSDs and the overhead of data duplication becomes relatively small. The performance of the HA configuration using mid-latency SSDs decreases to 39% because it takes O(100 µs) to read a data page for updates. Consequently, the performance of the HA configuration using low-latency SSDs was 2.4 times higher than the HA configuration using mid-latency SSDs in the case of 1% buffer size. The HA configuration using low-latency SSDs was 70% compared to the performance of the HA configuration with 100% buffer hits.
5.3 Case C
Case C evaluates the HA configuration using a mixed workload based on the TPC-C benchmark. In this evaluation, we compared the HA configurations using low/mid-latency SSDs with a practical HA configuration using an external SAN storage for data storage.
Figure 7 shows the result of the evaluation of Case C. Because we used larger servers than Cases A and B, we executed 30 transactions concurrently. Compared to the performance of the external storage configuration, the performance of the low-latency SSD configuration was 1.1 times faster at a buffer size of 100%, and 6.1 times faster at a buffer size of 5%. The low-latency SSDs configuration was 71% faster than the performance of the external storage configuration with 100% buffer hit. Compared to the mid-latency SSD configuration, it was 1.4 times faster for both 100% and 5% buffer size tests.
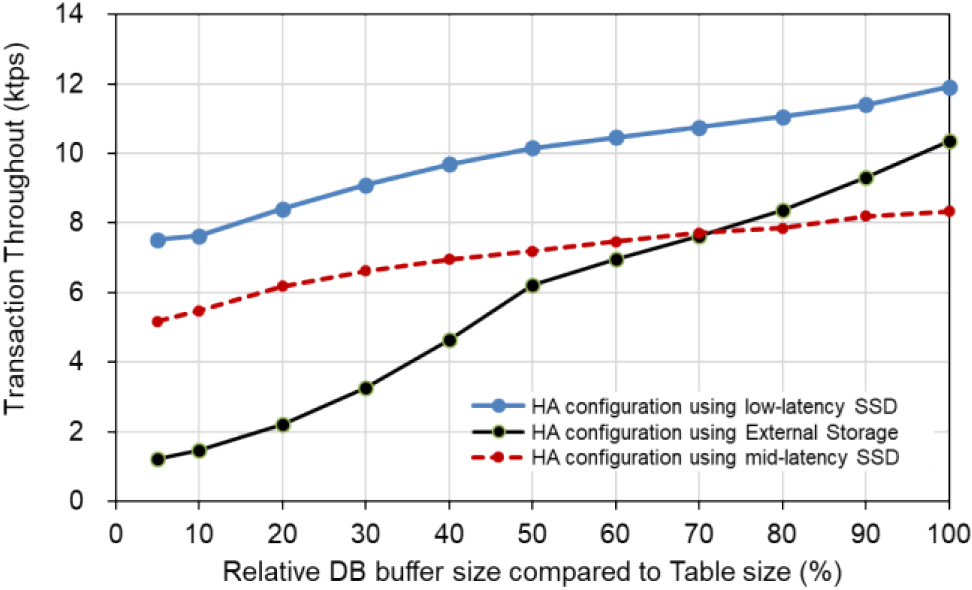
Because the Case C workload is based on the TPC-C benchmark, a single transaction updates multiple tables, and consequently the size of the update logs becomes larger than the update transactions of the primitive benchmark. This affects the performance of mid-latency SSDs, using NAND flash memory.
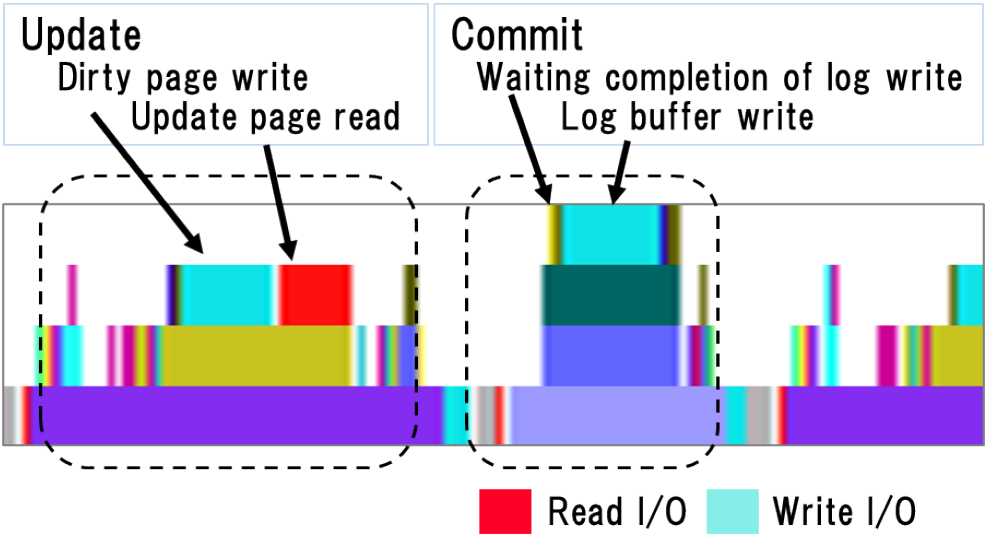
Figure 8 shows the traces of the mixed workload in the case of 100% buffer size. The horizontal axis indicates the elapsed time, and the vertical axis shows the individual transaction processes. As we execute 30 transactions simultaneously, each graph includes 30 transaction processes. Figure 9 shows the notations of the trace chart. In the graph, red indicate read I/O, and light-blue indicate write I/O. An update operation consists of a dirty buffer write and a buffer read for the update data. A commit operation consists of the waiting for of other log writes to complete and a log buffer write.
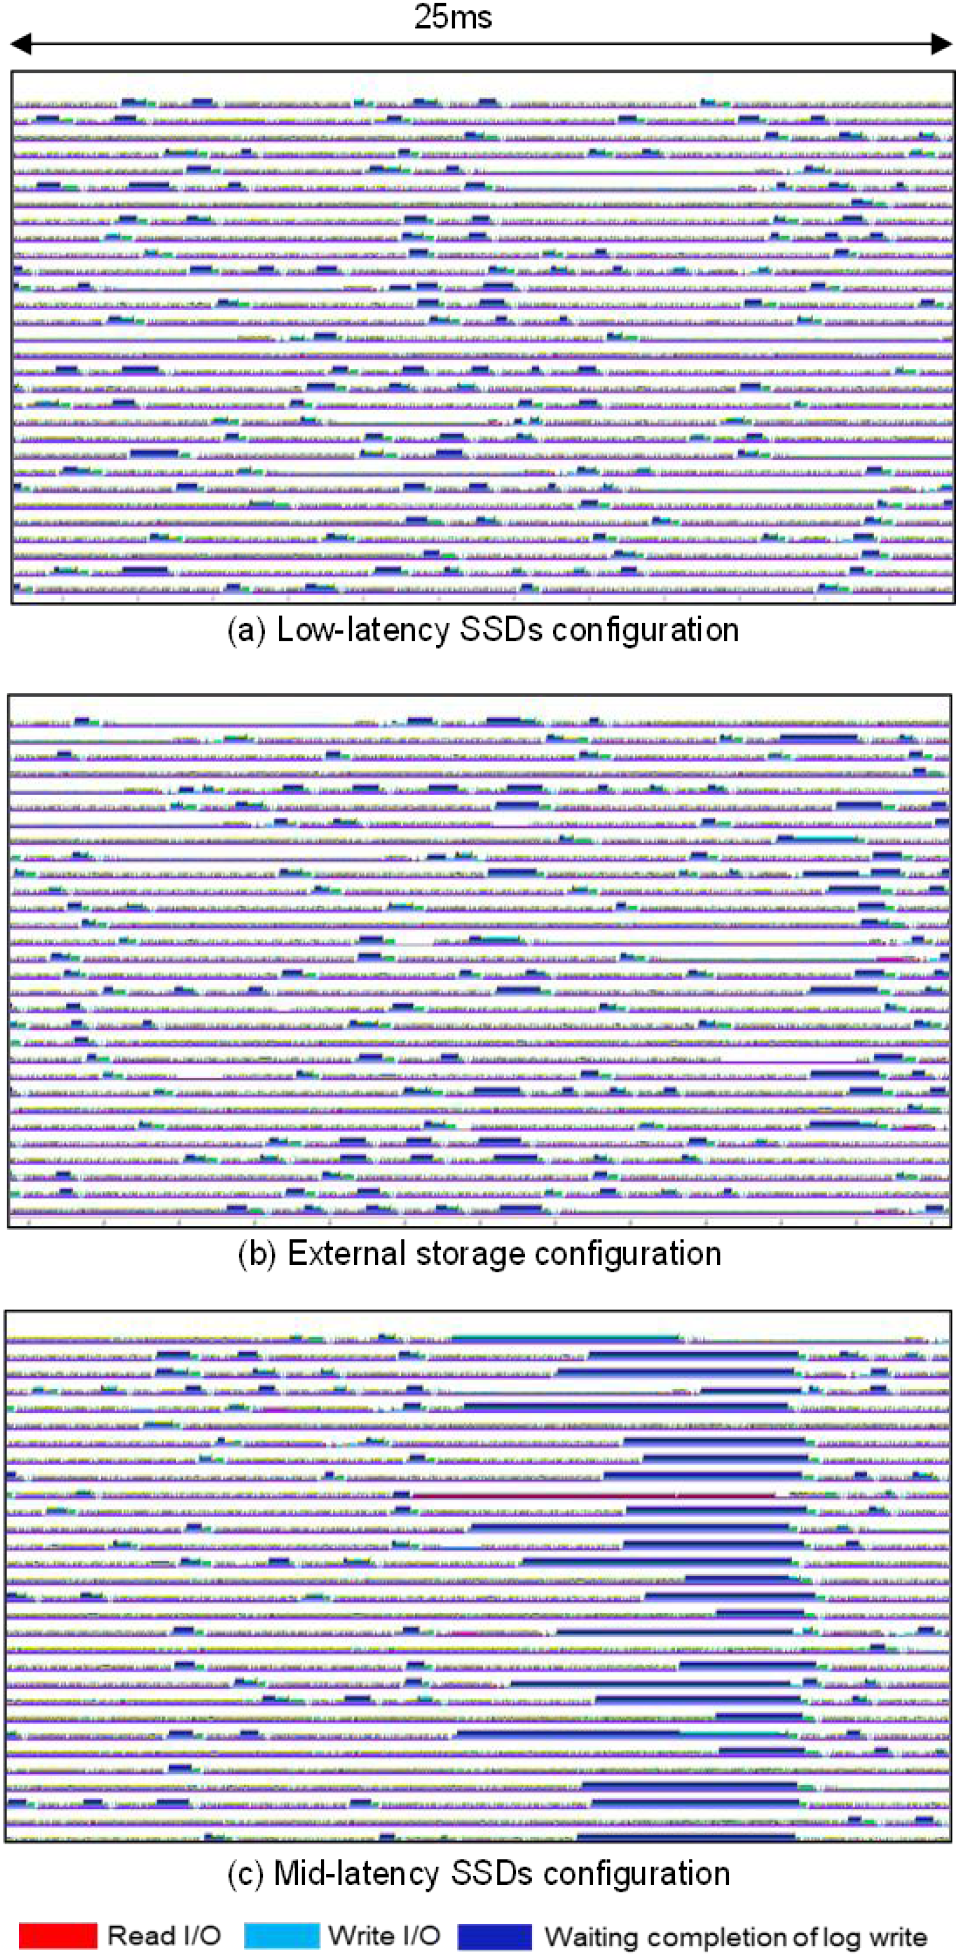
Because the database buffer size is 100% of the data size, there are no data page read I/Os. Deep blue indicates the waiting completion of the log writes. As this database system uses a group commit mechanism, sometimes multiple processes wait for a log write to complete at the same time.
In configurations of low-latency SSDs and external storage cases, I/O was not a significant bottleneck. However, in the configuration of mid-latency SSDs, the log writes indicated in light-blue sometimes took several milliseconds, resulting in a long wait for the log write to complete, causing a performance bottleneck.
Figure 10 shows the traces of the mixed workload in the case of a 5% buffer size. In this 5% buffer size case, most data access missed the database buffer, and read I/O was performed frequently.
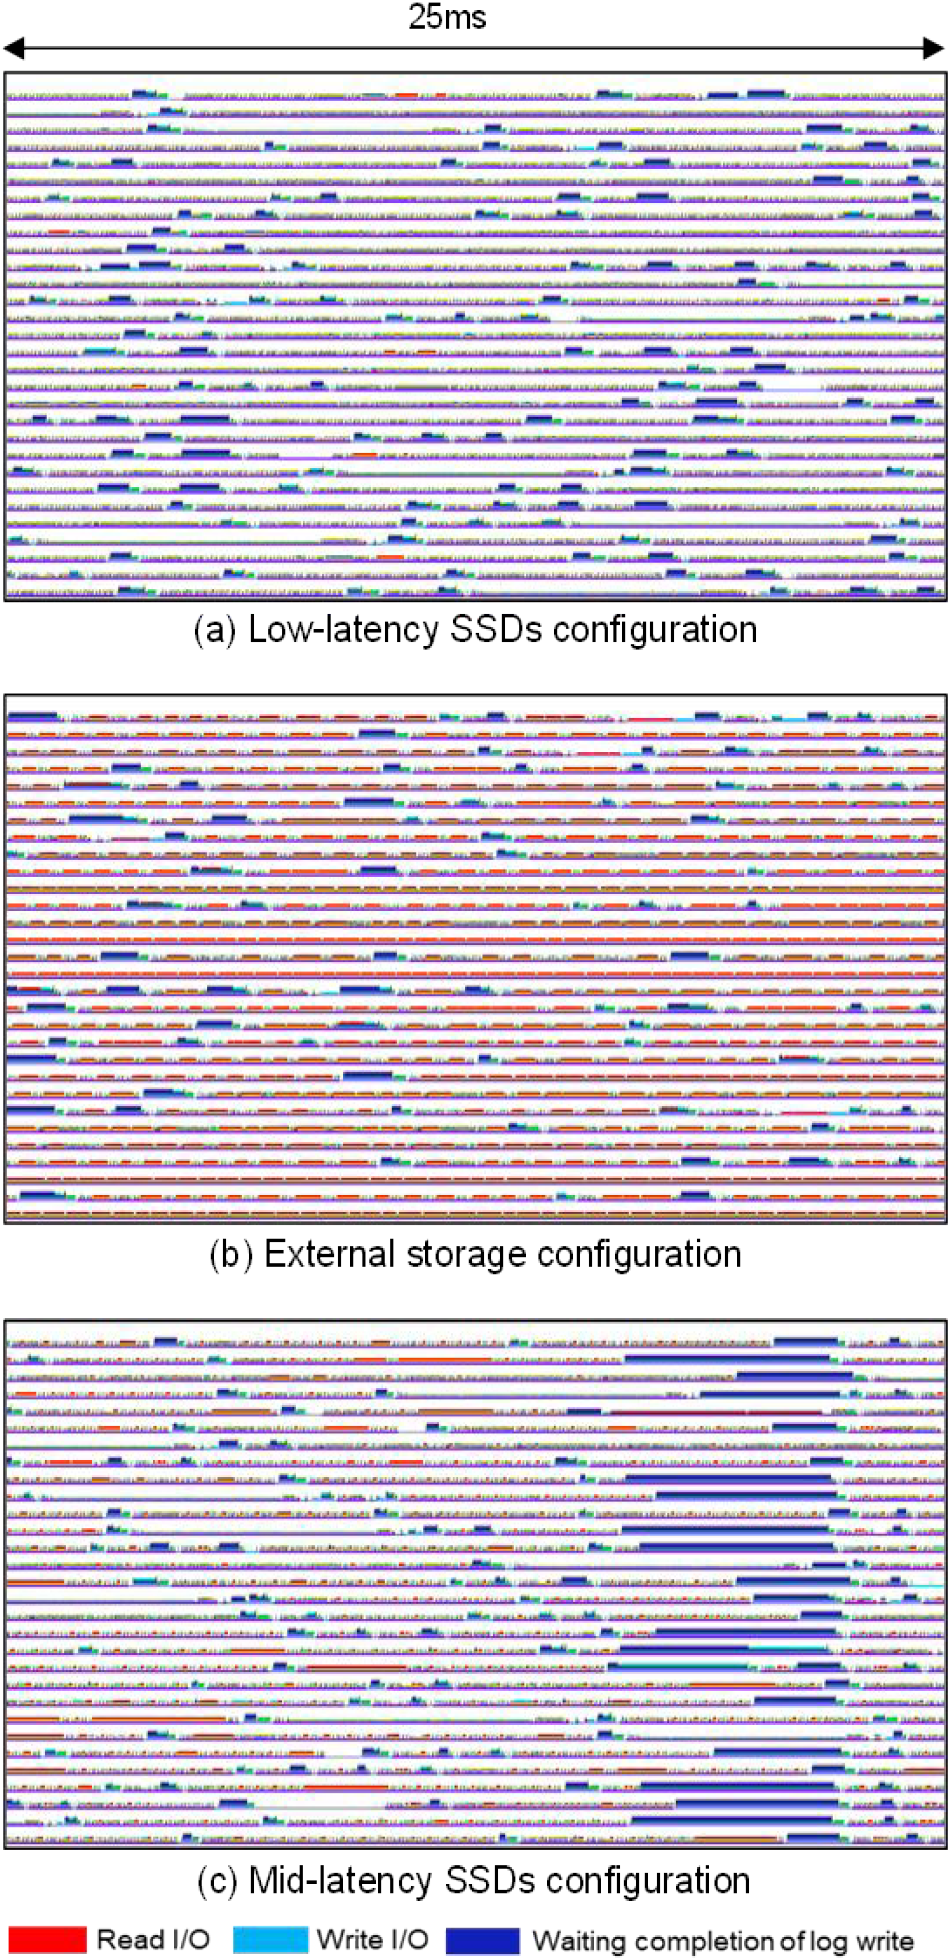
Even though the read I/O was frequently issued, the trace of low-latency SSDs indicated that there was no significant bottleneck due to I/O, and most of the time was spent on database processing in the CPUs. The trace of external storage shows that the read access to the data pages, which is shown in red, was a primary bottleneck. Therefore, most mission critical database systems that use external storage allocate a sufficiently large database buffer to reduce I/O access to storage. The trace of mid-latency SSDs indicates that read access to data pages sometimes takes O(ms). Mid-latency SSDs need to periodically gather and erase updated data pages. This causes long I/O latency and affects the database performance.
5.4 Cost Performance Analysis
According to the results of test cases B and C, the HA configuration using conventional NVMe SSDs or an external SAN storage is recommended to have the same size as the database buffer as data because the performance degrades rapidly if the buffer hit ratio is low. In contrast, the HA configuration using low-latency SSDs maintains 70% performance even in the case of a 5% buffer compared to the 100% buffer.
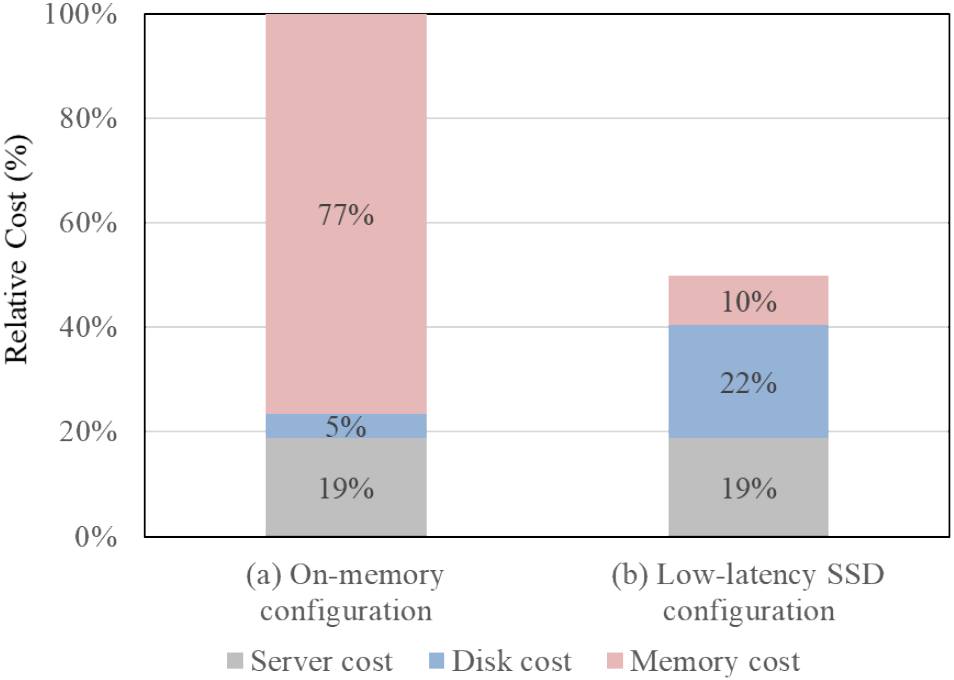
Table 2 lists the two server configurations. For these configurations, we assume that the database size is 1.5 TB. Table 2 (a) shows an on-memory configuration with mid-latency SSDs and a full-size database buffer. Table 2(b) shows a low-latency SSD configuration with low-latency SSDs and a database buffer of 5% size.
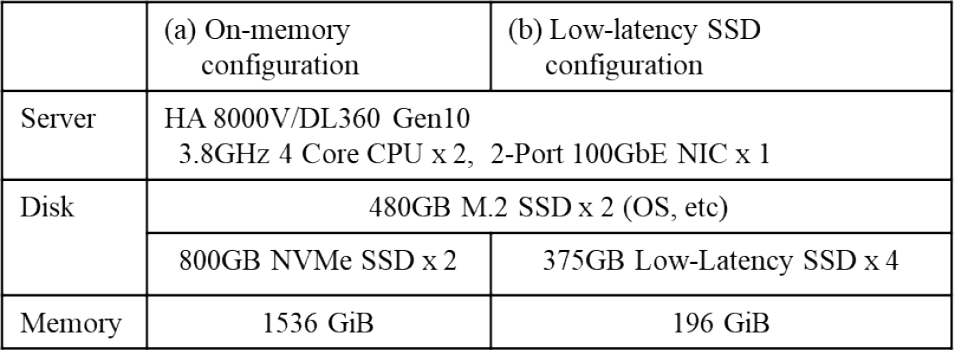
Figure 11 shows a relative comparison of the server costs for these two configurations. In the case of the on-memory configuration, 77% of the total cost is spent as memory cost. In the low-latency SSD configuration expensive low-latency SSDs are used instead of mid-latency SSDs, but the total cost is reduced to 51% compared to the on-memory configuration. Based on the results of test case B described in Section 5.2, the performance of the 5% buffer hit case for the configuration using low-latency SSDs was 70% compared to the 100% buffer hit case. Consequently, the cost performance of the configuration using low-latency SSDs was 1.4 times better than that of the on-memory configuration.
Note that the price of each component may change, and this comparison result may change in the future.
6. Concluding Remarks
In this study, we studied the performance of high-availability database systems using low-latency I/O devices. Because low-latency I/O devices are connected to the PCI bus on a database server, we configured two database servers connected with a 100 GbpE network, and we duplicated data using the NVMe over Fabrics protocol, which is suitable for NVMe SSD devices. We evaluated the single configuration and the HA configuration by changing the database buffer size from 1% to 100% of the database size.
The results of the single database configurations showed that the configuration using low-latency I/O devices with 1% database buffer size indicated 90% and 78% performance for select and update benchmarks, respectively, compared to the performance of 100% buffer size configuration. This result confirms the relative performance assessment by I/O latency described in Section 2.
In the evaluation of the HA configuration, we showed that the performance of the HA configuration using low-latency SSDs and the NVMe over Fabrics protocol was 88% compared to a single configuration, in the case of a 100% update transaction workload in Case B. The HA configuration using low-latency SSDs was 70% compared to the performance of the HA configuration with 100% buffer hit.
The result of the mixed workload benchmark in Case C indicated that the database system configuration using low-latency I/O devices was up to 6.1 times faster than the performance of the configuration using conventional NVMe SSDs when the allocated database buffer was 5% of the database size. The configuration using low-latency SSDs was 71% faster than the performance of the external storage configuration with 100% buffer hit.
HA configuration using conventional NVMe SSDs or an external SAN storage, experienced a rapid drop in performance at a low buffer hit ratio. However, the HA configuration using low-latency SSDs maintained 70% performance even in the 5% buffer case compared to the 100% buffer case. We evaluated the cost performance in Section 5.4 and found that the cost performance of the configuration using low-latency SSD was 1.4 times better than that of the on-memory configuration.
From the above results, we conclude that low-latency I/O devices are promising devices for high-availability database systems.
References
- [1] Barroso, L., Marty, M., Patterson, D. and Ranganathan, P.: Attack of the Killer Microseconds, Comm. ACM, Vol.60, No.4, pp.48–54 (2017).
- [2] Webb, M.: Overview of Persistent Memory, Proc. of Flash Memory Summit 2018 (Pre-conference Seminars), Santa Clara, USA. Available from (2018). 〈https://www.flashmemorysummit.com/Proceedings2019/08-05-Monday/20190805_PreConfC_Sainio.pdf〉, (accessed 2021-01-18).
- [3] Intel [Internet]. Santa Clara, USA: News Release; [cited 2015 Jul 28]. Intel and Micron produce breakthrough memory technology; [about 2 screens]. Available from 〈https://newsroom.intel.com/news-releases/intel-and-micron-produce-breakthrough-memory-technology/〉, (accessed 2021-01-18).
- [4] Samsung [Internet]. Korea: Newsroom; c2010–2019 [cited 2018 Jan 30]. Samsung Electronics Launches 800-Gigabyte Z-SSDTM for HPC Systems and AI Applications. Available from 〈https://news.samsung.com/global/samsung-electronics-launches-800-gigabyte-z-ssd-for-hpc-systems-and-ai-applications〉, (accessed 2021-01-18).
- [5] NVM Express [Internet]. Beaverton, USA; c2007–2017 [cited 2017 May 1]. NVM Express Revision 1.3. Available from 〈http://nvmexpress.org/wp-content/uploads/NVM_Express_Revision_1.3.pdf〉, (accessed 2021-01-18).
- [6] Drake, S., Hu, W., McInnis, D. M., Sköld, M., Srivastava, A., Thalmann, L., Tikkanen, M., Torbjørnsen, Ø. and Wolski, A.: Architecture of Highly Available Databases, Proc. of First International Service Availability Symposium, Munich, Germany. Berlin: Springer (2015).
- [7] Xu, Q., Siyamwala, H., Ghosh, M., Suri, T., Awasthi, M., Guz, Z., Shayesteh, A. and Balakrishnan, V.: Performance analysis of NVMe SSDs and their implication on real world databases, Proc. of the 8th ACM International Systems and Storage Conference, Haifa, Israel. New York: ACM (2015).
- [8] Coburn, J., Bunker, T., Schwarz, M., Gupta, R. and Swanson, S.: From ARIES to MARS: transaction support for next-generation, solid-state drives, Proc. of the 24th ACM Symposium on Operating Systems Principles, Pennsylvania, USA. New York: ACM (2013).
- [9] Renen, A., Leis, V., Kemper, A., Neumann, T., Hashida, T., Oe, K., Doi, Y., Harada, L. and Sato, M.: Managing Non-Volatile Memory in Database Systems, Proc. of the 2018 ACM SIGMOD International Conference on Management of Data, Huston, USA. New York: ACM (2018).
- [10] Arulraj, J. and Pavlo, A.: How to Build a Non-Volatile Memory Database Management System, Proc. of the 2017 ACM SIGMOD International Conference on Management of Data (tutorial), Chicago, USA. New York: ACM (2017).
- [11] Zhang, Y., Yang, J., Memaripour, A. and Swanson, S.: Mojim: A Reliable and Highly Available Non-Volatile Memory System, Proc. of the 20th International Conference on Architectural Support for Programming Languages and Operating Systems, Istanbul, Turkey. New York: ACM (2015).
- [12] NVM Express [Internet]. Beaverton, USA; c2007–2016 [cited 2016 Jun 5]. NVM Express over Fabrics Revision 1.0. Available from 〈http://nvmexpress.org/wp-content/uploads/NVMe_over_Fabrics_1_0_Gold_20160605-1.pdf〉.
- [13] Guz, Z., Li, H., Shayesteh, A. and Balakrishnan, V.: Performance Characterization of NVMe-over-Fabrics Storage Disaggregation, ACM Trans. Storage, Vol.14, No.4, pp.Article 31 (2018).
- [14] TPC [Internet]. San Francisco, USA; c2001–2019 [cited 2010 Feb]. TPC BENCHMARKTM C Standard Specification Revision 5.11. Available from 〈http://www.tpc.org/tpc_documents_current_versions/pdf/tpc-c_v5.11.0.pdf〉, (accessed 2021-01-18).
- [15] HammerDB [Internet]. c2019. HammerDB Benchmarks. Available from 〈https://www.hammerdb.com/index.html〉, (accessed 2021-01-18).

Shinji Fujiwara fujiwara-shinji@ed.tmu.ac.jp
Shinji Fujiwara is a chief engineer of the IoT & Cloud Services Business Division at Hitachi, Ltd., and a working student of a doctorate course at Tokyo Metropolitan University. He is also a member of IPSJ, IEICE, DBSJ, IEEE, and ACM.

Riro Senda
Riro Senda is a senior engineer of the IoT & Cloud Services Business Division at Hitachi, Ltd. He has been engaged in developing of database management systems.

Isamu Kaneko
Isamu Kaneko is a senior engineer of the IT Platform Products Management Division at Hitachi, Ltd. He is engaged in the development of storage devices for server.

Hiroshi Ishikawa
Hiroshi Ishikawa is a distinguished leading professor and an emeritus professor of Tokyo Metropolitan University (TMU). He is also the director of TMU Social Big Data Research Center. His research interests include database, data mining, and big data. He has published actively in international journals and conferences, such as ACM TODS, IEEE TKDE, VLDB, IEEE ICDE, and ACM SIGSPATIAL and MEDES. He has authored a dozen of books, which include books entitled How to Make Hypotheses (in Japanese, Kyoritsu Shuppan, 2021) and Social Big Data Mining (CRC, 2015). He received Commendation for Science and Technology by the Minister of Education, Culture, Sports, Science and Technology of Japan in 2021. He is fellows of IPSJ and IEICE and members of ACM and IEEE.
再受付日: 2021年6月14日
採録日: 2021年9月13日
会員登録・お問い合わせはこちら
会員種別ごとに入会方法やサービスが異なりますので、該当する会員項目を参照してください。