A New Method of Subjective Evaluation Using Visual Analog Scale for Small Sample Data Analysis
1. Introduction
1.1 The Problem with Likert-type Evaluations
Likert-type evaluations have been widely used in various research fields, including psychology and subjective evaluation, for questionnaire items. The Likert-type evaluation is a type of psychometric response scale in which the degree of agreement (or non-agreement) to a question is answered stepwise and is widely used in various surveys. A five-point Likert-type scale of agreement with questions is often used due to its simplicity. We discuss the problems with this evaluation method. Likert-type items' scores cannot be treated as an interval scale since they follow an ordinal scale. In this case, the parametric test cannot be applied; only the non-parametric test can be used.
The ease of answering questions is also an important issue. A question format that feels burdensome to answer will not attract a sufficient number of subjects. Questionnaires with a large number of questions are particularly burdensome for subjects to answer. A large number of points to choose from as a scale will also burden the answer. Inoue et al. conducted computer simulations of the relationship between sample size and Likert scale question style [1]. They confirmed that the conditions for confirming normality with a probability of more than 50% are that the scale point of responses should be more than 11 scale points, and the sample size should be about 50. They also propose increasing the Likert scale steps or using the VAS method when the sample size is small.
Biases that occur during the evaluation should also be considered. Because the Likert scale is discrete, unintentional bias can have a significant impact. The smaller the number of selection points as a scale, the greater this effect will be. One of the biases that the Likert scale has is the central tendency bias. This bias is due to the inclusion of the neutral option of “neither.” When the number of the scale points is odd, the neutral option to do neither is selectable. Other biases include the halo effect, in which one positive rating has a positive effect on other ratings, and the leniency bias, in which subjects give higher ratings because, for example, they want to be thought of well by the evaluator [2].
Thus, in Likert-type evaluation, problems have been pointed out such as the need to treat it as an ordinal scale, the need for sufficient sample size for statistical processing, the problem of increasing the number of steps, such as 9-point and 11-point scales, which increases the response burden, central tendency bias, halo effect, and leniency bias.
1.2 Proposal of a New Subjective Evaluation Method using VAS
Sufficient sample size is one of the essential factors for subjective evaluation experiments. However, it is not easy to prepare the necessary sample size to confirm a statistically significant difference. Therefore, we focused on the VAS and proposed a new subjective evaluation method that enables us to understand the characteristics of the subjects' subjective responses even when the sample size is small.
Our concept is inspired by the Weissgerber et al. study, which suggests that all data distribution should be visualized, and trends should be captured in small samples [3]. The presentation of all data may suggest a different conclusion than the presentation of descriptive statistics values. Descriptive statistic value is useful only when sufficient data are available, and small sample size may suggest different conclusions than all data presentations. Therefore, when the sample size is small, the best choice is to display the complete data.
Also, the evaluation value by VAS can be treated as an interval scale. Reips et al. conducted experiments on the Web comparing VAS with categorical scales such as radio buttons and confirmed in their experiments that the data handled by VAS could be safely applied to a wide range of statistical procedures, including parametric tests as interval scale data [4]. In general, parametric tests are statistically more powerful than non-parametric tests. With this in mind, Bishop et al. point out that the VAS method provides adequate data that can be used for parametric tests [5]. Weissgerber et al. recommend univariate scatterplots and box plots for visualizing small sample data. However, univariate scatter plots have the disadvantage that information is lost when there are too many ties. The beeswarm plot does not have this drawback because the dots do not overlap. The box plot is also the value of a descriptive statistic and is therefore only valid if the sample size is large enough. When the sample size is small, it is essential to plot the descriptive statistics value and the total data. When using whole data plots, i.e., univariate scatter plots, it is impossible to represent the same data's overlap. The use of the beeswarm plot has been recommended in recent years. Therefore, we propose to plot a beeswarm plot superimposed on a box plot when the sample size is small.
As mentioned above, we propose the following three hypotheses in this paper.
- (1)It is recommended that all data be plotted if only a small size of data is available.
- (2)Using VAS, subjective evaluation data can be treated as an interval scale.
- (3)Therefore, when conducting small-sized subjective evaluation experiments, it is useful to acquire VAS data, calculate histograms and a five-number summary, and then display all the data in box plots or beeswarm plots.
Our proposed method assumes that a sufficient sample size is not available. The scale of preliminary experiments to test the hypothesis conducted by each laboratory is small. There may also be cases where the number of target people is small to begin with, such as the elderly, the disabled, or groups with specific attributes. In such a case, statistical analysis is difficult, and LS can only look at the distribution stepwise. However, even when the sample size is small, it can still be measured with VAS, and the combination of box plots and beeswarm plots shows the overall trend better than LS. The proposed method allows us to analyze some subjective information, even when the sample size is small.
We have been proposing a new analytical method for subjective evaluation experiments using VAS for several years. The research topics with this method are painting appreciation [6], music appreciation [7], visual sensitivity to grayscale [8], and participation attitude to the Internet [9].
This study investigates the psychological change that the talking robot's conversation exerts on the user with the proposed method. We analyze the user responses obtained from conversations with a talking robot, focusing on the difference between smooth and non-smooth conversations. Data visualization, hierarchical clustering, and statistical hypothesis testing are used to analyze the experimental results.
2. Visual Analog Scale
2.1 Overview of VAS
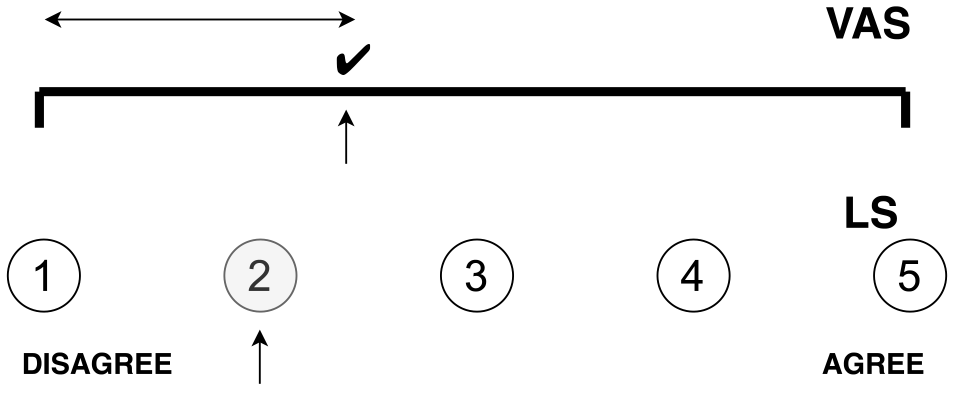
The VAS is a subjective evaluation method that expresses one's subjectivity by marking on a 100-mm horizontal line between 0 and 1 and quantifies it by its length. Figure 1 shows an image of the VAS compared to the LS. The VAS has been a highly sensitive pain assessment method in the medical field and is widely used. Myles et al. conducted a study on the VAS's linearity for the representation of pain [10]. They expressed that the VAS results for patients with mild to moderate pain have characteristics consistent with a linear scale and that the VAS scores can be treated as ratio data. Andy et al. conducted an extensive review of research papers on VAS, showing that the first scientific description of VAS was Hayes and Patterson's “Graphic Rating Method” (1921) and that VAS is still a valid method today [11]. James et al. conducted a study comparing VAS and LS (7 and 11 points) [12]. They concluded the VAS does not appear to be interchangeable with the Likert-style items in their experiment. We also have confirmed that there is a difference in the trend between LS and VAS. We conducted a comparative study on VAS and LS's subjective ratings in more than 170 subjects and showed some bias between VAS and LS [13].
2.2 Development of VAS App
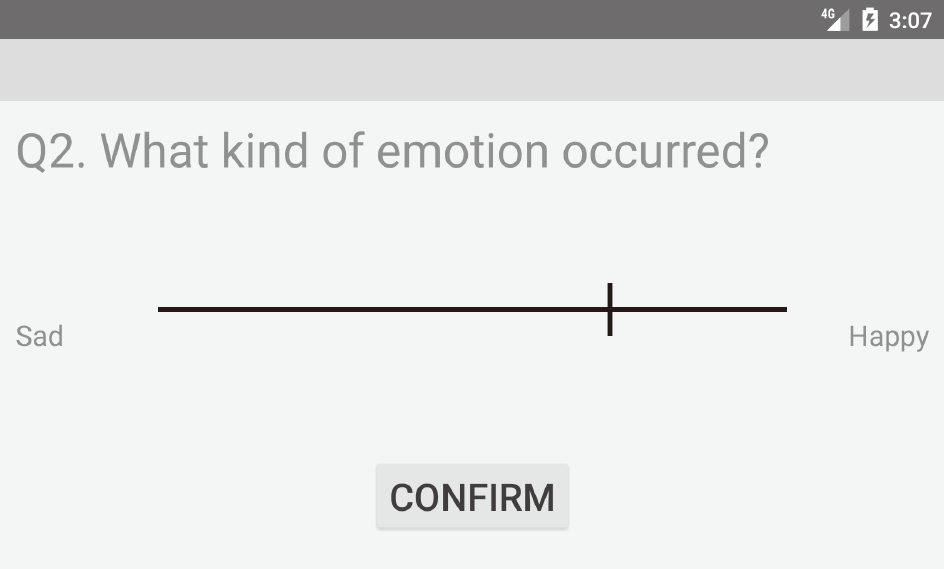
VAS is a sensitive measurement method and requires much effort to measure, quantify, and tabulate the questionnaire form's distances. Therefore, we developed an application called “VASpad” to measure VAS with a smartphone/tablet [14]. Figure 2 shows screenshots of the VASpad. The line's length obtained by tapping the straight line for VAS measurement in the app is taken as the measurement and normalized to fit between [0, 1]. We confirmed no significant difference between the app's VAS measurement and the questionnaire's VAS measurement in the previous study [14].
3. Talking Robot
This study used OHaNAS (Organized Human Interface and Network Artificial Intelligence System) as an experimental talking robot. OHaNAS is a conversational robot co-developed by NTT DoCoMo and TOMY and is the world's first robot to incorporate DoCoMo's natural dialogue platform technology. We can talk to OHaNAS via a dedicated app on the Internet-connected smartphone.
When entering the smartphone application profile, the OHaNAS makes a conversation with the user's consideration. When we launch OHaNAS for the first time, it provides us with dates, travel knowledge, and related quotes as conversation topics. OHaNAS is linked to DoCoMo's servers to respond by leveraging its knowledge of the Internet.
4. Subjective Evaluation Experiment
4.1 Experimental Method
In this section, we describe our experiment. The purpose of our experiment is to clarify the subjective ratings of individuals on VAS measures. The theme of the experiment was to evaluate the impressions received from conversations with a talking robot. We set up two corresponding groups, one in which the conversation flowed smoothly and the other in which it did not, and analyzed the differences in each measurement. We tested whether the VAS could detect subtle differences in impressions due to these differences in the conversation's smoothness. Although the conversation partner's identity has a significant impact on the impression of the conversation, in this experiment, it was assumed that the individual differences in the impact would be small because the conversation partner was a robot. We have confirmed that none of the experimental collaborators use this talking robot daily.
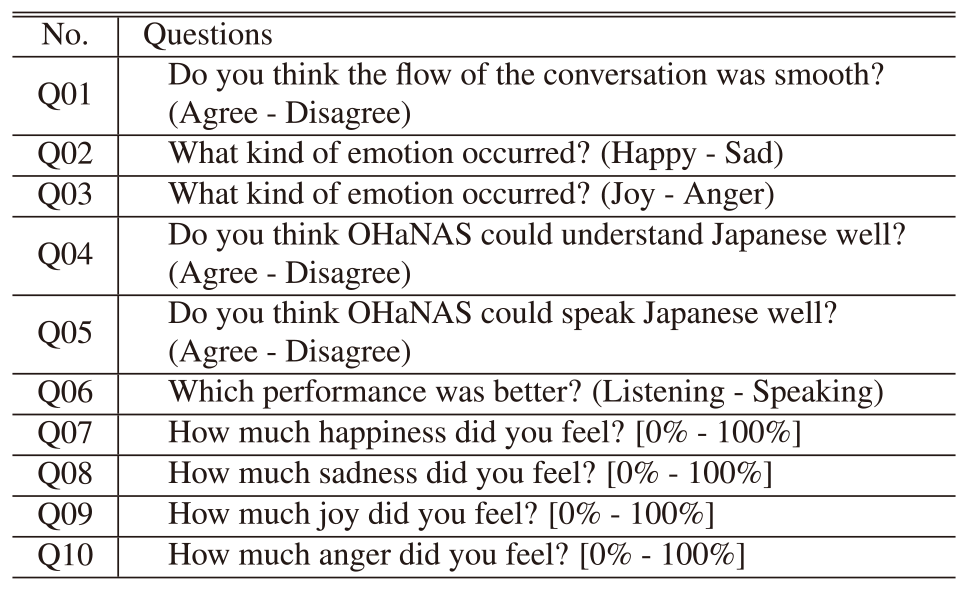
We conducted a subjective evaluation of conversational impressions with a talking robot using a newly developed VAS application for 30 students based on these principles. Collaborators in this experiment ranged in age from 18 to 20 years old. We used TAKARA TOMY's “OHaNAS” as a talking robot. The flow of the experiment is as follows. To begin with, an experimental collaborator talks with OHaNAS for 5–10 minutes. Afterward, the experimental collaborators will answer ten questions. The ten questions are shown in Table 1. We explain how we created these questions. These ten questions were developed with the following intentions in mind. First, we will check in Q01 based on the experiment, the smoothness of the conversation. We then set up several questions about the impression of the talking robot's performance and the robot's impression of conversation. We then set up several questions about the impression of the talking robot's performance and the impression of conversation with the robot because we believe that users perceive the robot's performance to be superior when the conversation is smooth and perceive the robot's performance to be inferior when the conversation is not smooth. We also asked questions about the ability to listen and the ability to speak, respectively. Here we have set up questions to identify each skill. We have thus set up questions for Q04, Q05, and Q06:
- ・Q04 asks about the robot's listening skills.
- ・Q05 asks about the robot's speaking skills.
- ・Q06 is a question that asks whether the robot has better listening or speaking skills.
We then set up questions about the emotions recalled from the conversation. This time, we set up questions about two emotional pairs: “Are you happy or sad?” and “Are you pleased or angry?”. Q02 and Q03 apply to the above questions. We were also interested in emotional asymmetry, which we thought could also be measured by the VAS, so we set up questions to ascertain the degree of a single emotion, such as Q07, Q08, Q09, and Q10.
4.2 Histogram and Descriptive Statistics Value
We measured the ratings of 30 collaborators on these ten questions using the VAS app. Interval [0,1] values were obtained for smooth and non-smooth conversations, respectively. First, we draw a histogram of the data and obtain descriptive statistics values to identify trends in cases where the conversation was smooth and cases where it was not. The histogram in Fig. 3 reveals the tendency in cases where this conversation was smooth and others where it was not.
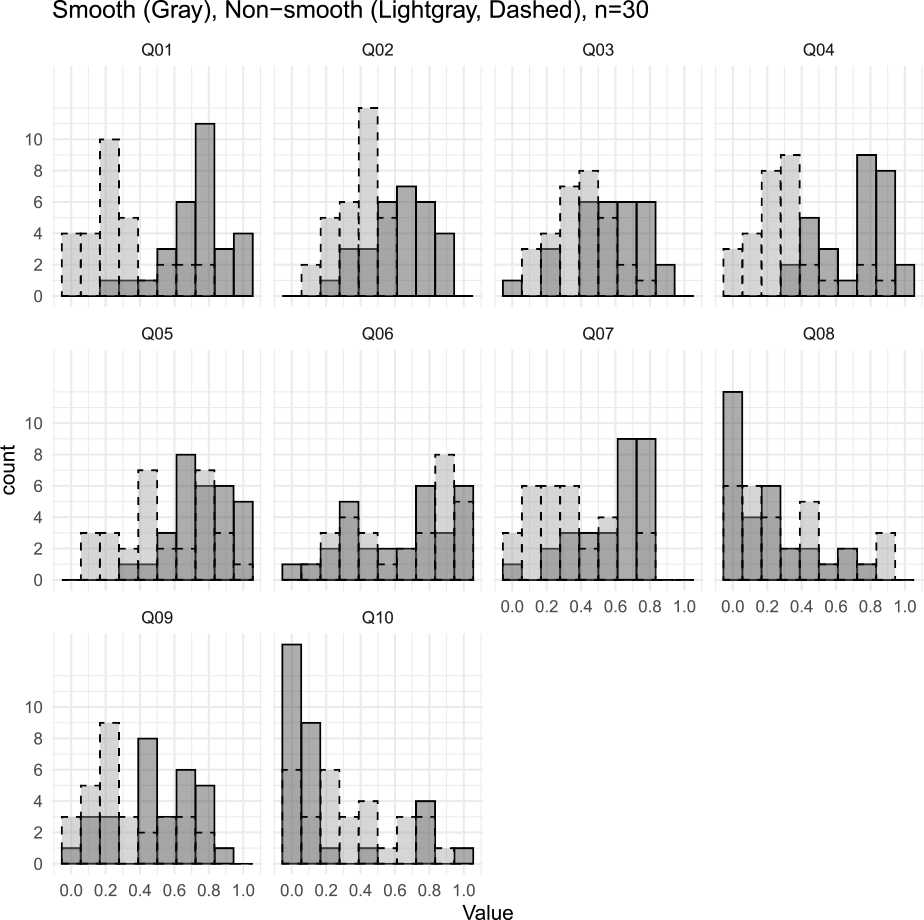
The x-axis represents the measured value, and the y-axis represents the frequency. The histogram is drawn in gray when the conversation was smooth and in light gray when it was not. Less overlap between darker and lighter grays implies that the conversation's smoothness significantly impacted the responses' differences.
For example, Q01 is a question about the smoothness of the conversation itself, and there is little overlap between the gray and light gray areas. On the other hand, in Q06, the histograms are almost overlapped between gray and light gray, suggesting that the conversation's smoothness may not have impacted responses. Q06 was a question asking which is a better skill, listening skills or speaking, and it seems that this is not dependent on the conversation's smoothness.
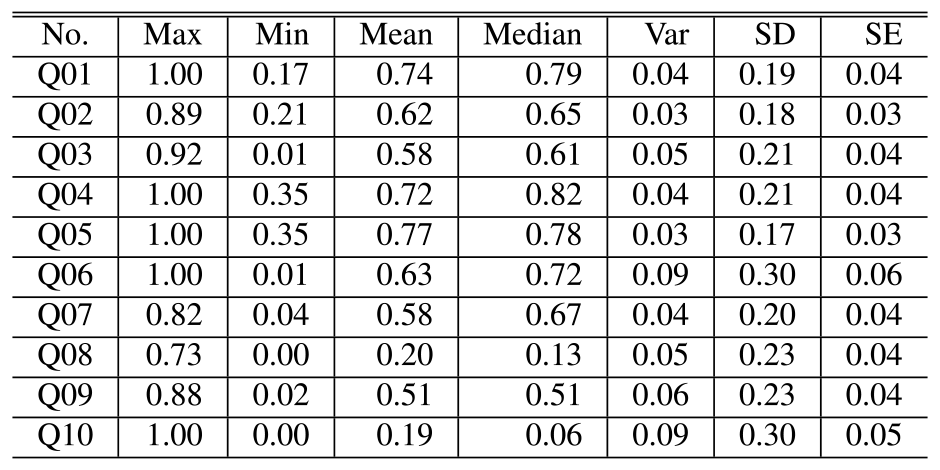
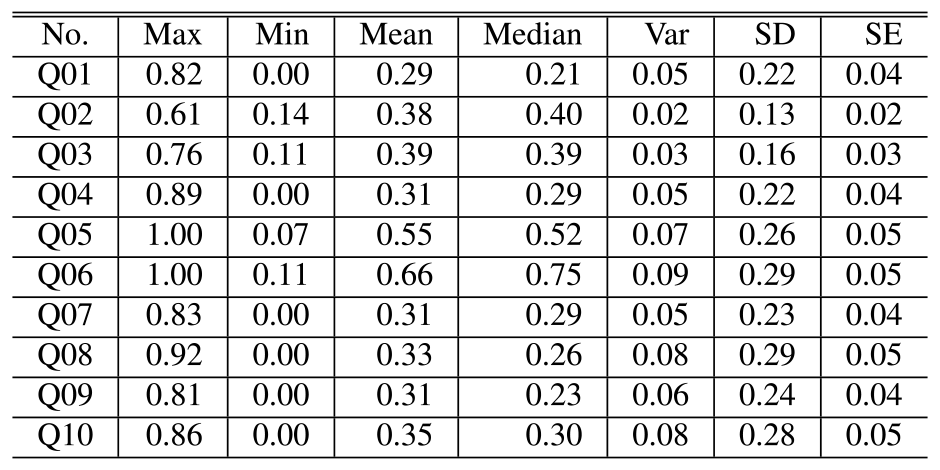
The measurements' descriptive statistics values are shown in Table 2 and Table 3 (SD stands for standard deviation, and SE stands for standard error). Table 2 shows the values calculated from measurements when the conversation was smooth, and Table 3 shows the values calculated from measurements when the conversation was not smooth. Of the above data, a line graph with the mean and standard deviation is shown in Fig. 4. The gray line graph represented the measurement when the conversation was smooth, and the light gray dashed line graph represents the measurement when the conversation was not smooth. From this table and figure, the following items were identified.
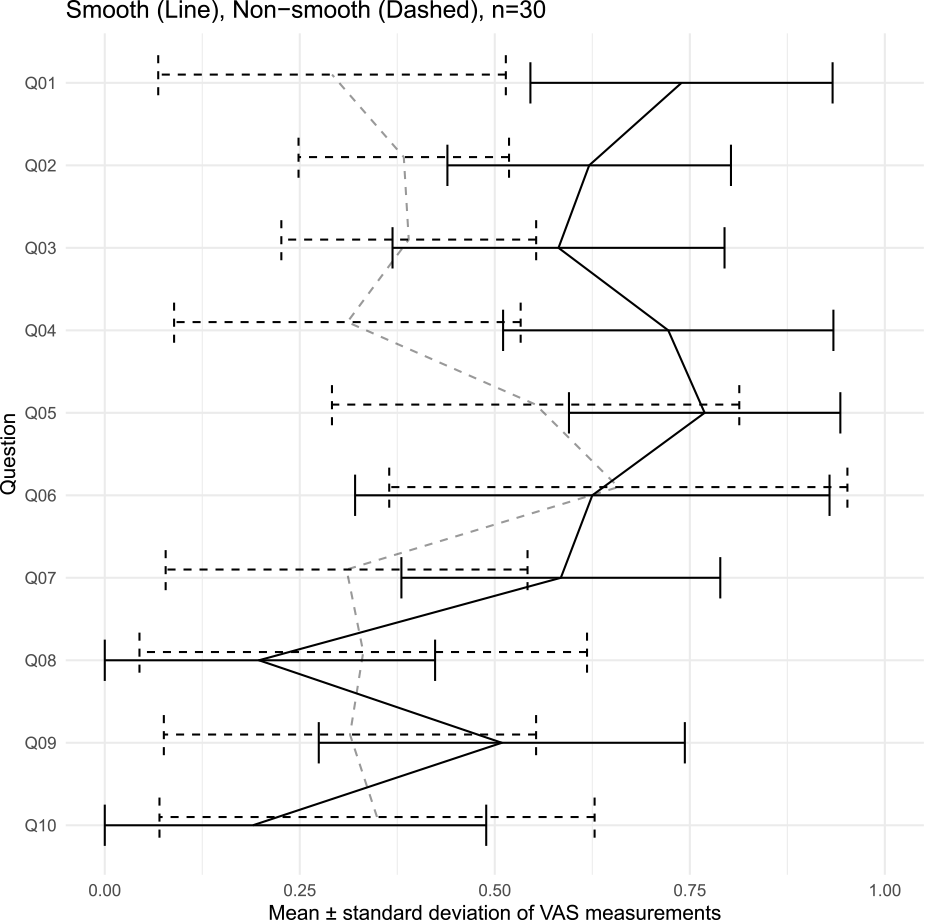
- ・Q01, Q02, Q03, Q04, Q05, Q07, and Q09, the measurements tend to be higher when the conversation is smooth and lower when the conversation is not smooth.
- ・Q08 and Q10 are measured higher when conversations are not smooth.
- ・As for Q06, there is no significant difference between the two cases.
Interpreting the above items according to the question, we can say the following.
- ・Responses to Q01 were, as expected, split neatly into smooth and not-so-smooth conversations.
- ・We can confirm the tendency to feel happy and joy when the conversation is smooth and perceive the robot's conversational skills as excellent.
- ・Whether the conversation is smooth or not, it does not significantly impact the impression of the robot's conversational skills.
4.3 Box Plot and Beeswarm Plot
Besides the histogram and the mean ± standard deviation, we also try to analyze the data with a box plot. A box plot is a robust summary statistic called a five-number summary. One of the features of the box plot is that it uses the median rather than the mean. In this experiment, the trends in the distribution of subjective ratings are not known a priori. For example, many outliers were observed and could affect the results of the analysis. The box plot, which uses the median and each quartile to visualize the data distribution, is robust to outliers and allows us to visualize the data distribution features in these cases somewhat accurately.
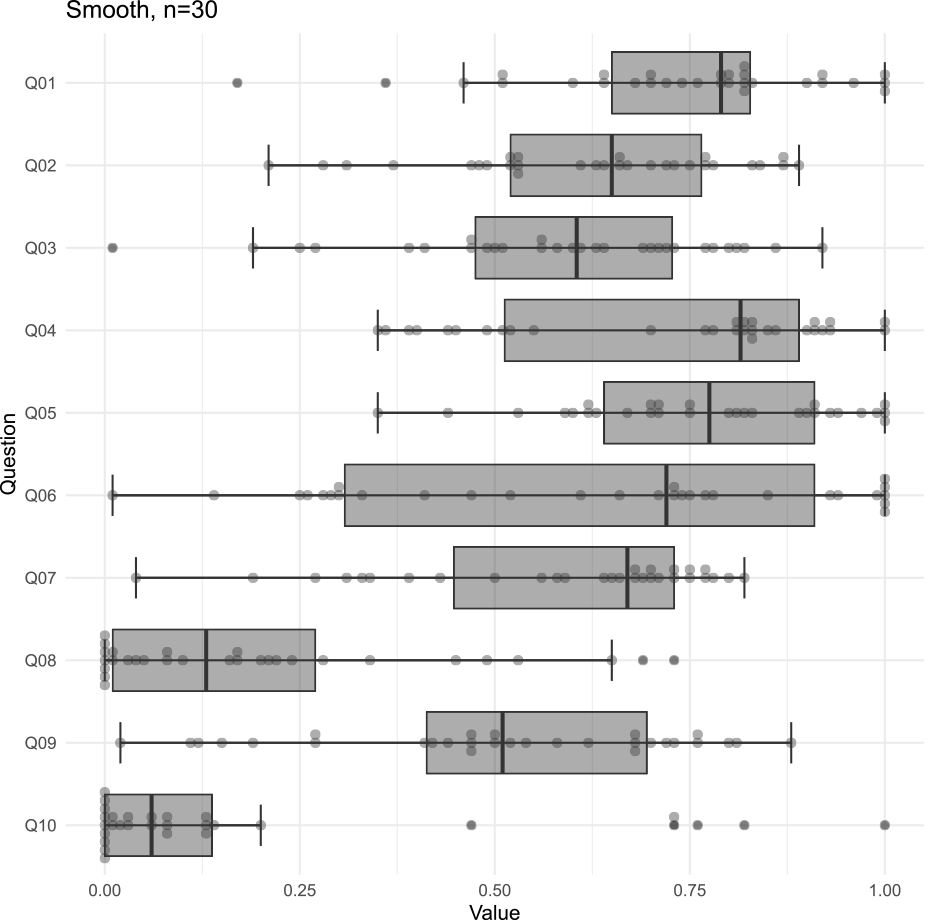
Fig. 5 shows the distribution of the measured values as a box plot. Several questions show that values smaller than the lower whisker and larger than the upper whisker are plotted as outliers. The boxes are plotted in the first and third quartiles and are less susceptible to outliers. The gray box represents the distribution of measurements when a conversation is smooth, and the light gray box represents the distribution of measurements when a conversation is not smooth. We can expect to intuitively understand the distribution of skewness and kurtosis in the data using the box plot. The gray and light gray boxes are farthest away from each other in Q01, directly related to the conversation's smoothness. Also, questions about happiness, such as Q02 and Q07, show a similar separation between the gray and light gray boxes. We can intuitively understand the distribution trend from this figure, which has been challenging to understand with histograms and mean and standard deviation.
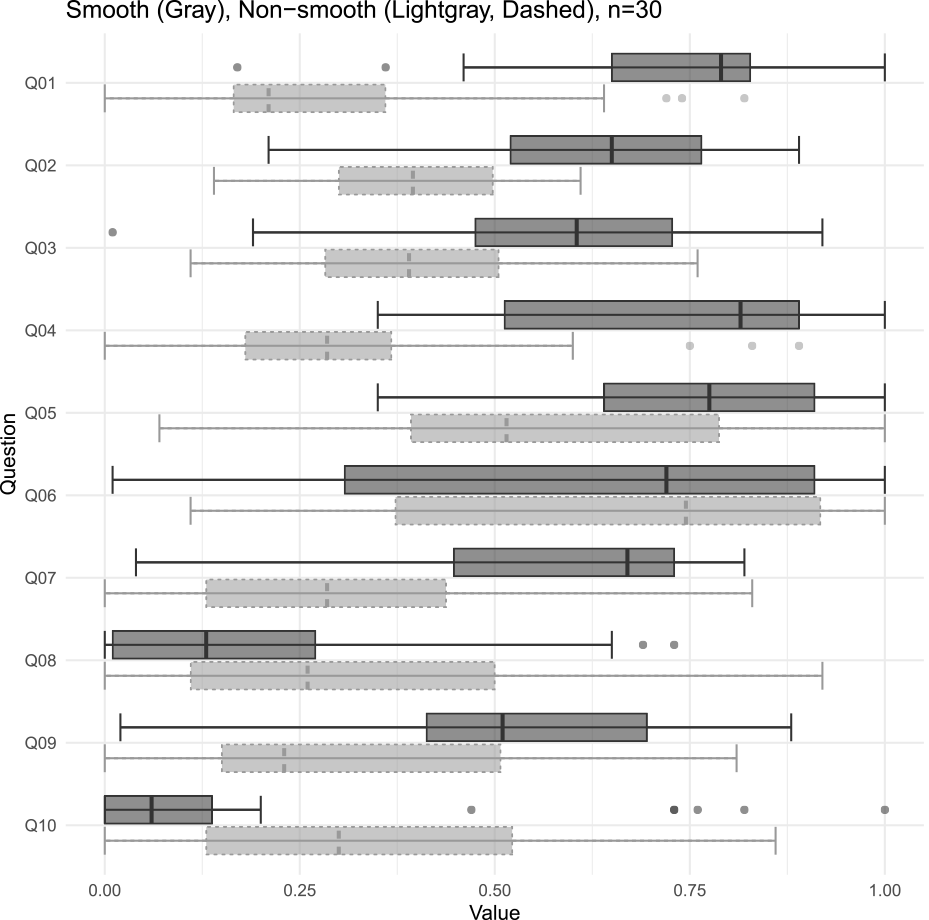
Q08 and Q10 showed relatively low negative emotions, such as sadness and anger, even when the conversation was not smooth. We initially expected that our collaborators would be more likely to become sad or angry when the robot's conversation was not smooth. However, the experiment results confirmed that even if the conversation was not smooth, the participants did not have a negative impression of the robot.
Both Q04 and Q05 are questions about the robot's conversational skills, asking about the skills of understanding conversations and speaking in conversations, respectively. For Q04, which asks about the skill of understanding conversation, the gray and light gray boxes are far apart when the conversation is smooth and when it is not, whereas, for Q05, which asks about the skill of speaking the conversation, the gray and light gray boxes overlap slightly. The overlap between the gray and light gray boxes in Q06 shows that the conversation's smoothness does not affect whether one is better at comprehension or conversation.
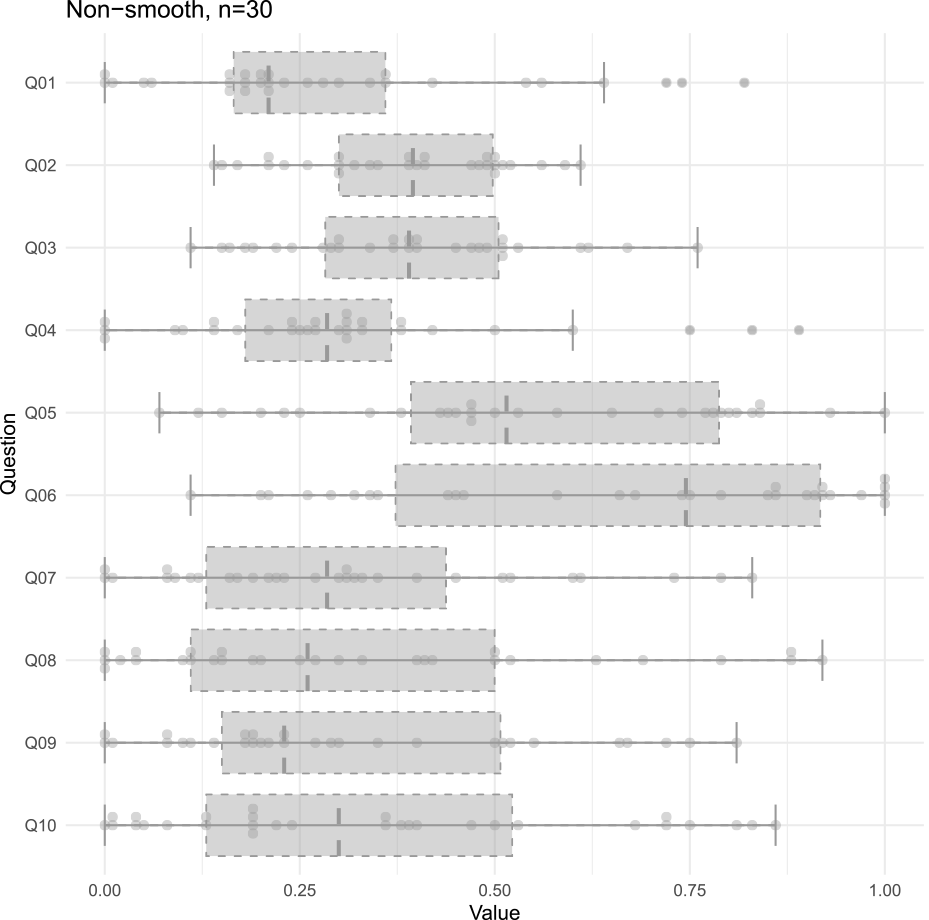
Figure 6 shows a superimposed plot of the box plot and beeswarm plots of measurements when the conversation is smooth, and Fig. 7 shows a similar plot of measurements when the conversation is not smooth.
4.4 Hierarchical Cluster Analysis
We performed a hierarchical cluster analysis to discover similar questions. The ten questions can be broadly divided into two categories: those related to the talking robot's performance and those asking about the impressions they get from the conversation. These are our research questions: is there a connection between questions about performance and questions about impressions, and are positive impressions, such as happiness and joy, distinguished from negative appreciation, such as sadness and anger, as clusters?
Figure 8 and Fig. 9 show a dendrogram with distances between clusters based on the Ward method. Figure 8 is when the conversation is smooth, and Fig. 9 is when the conversation is not smooth.
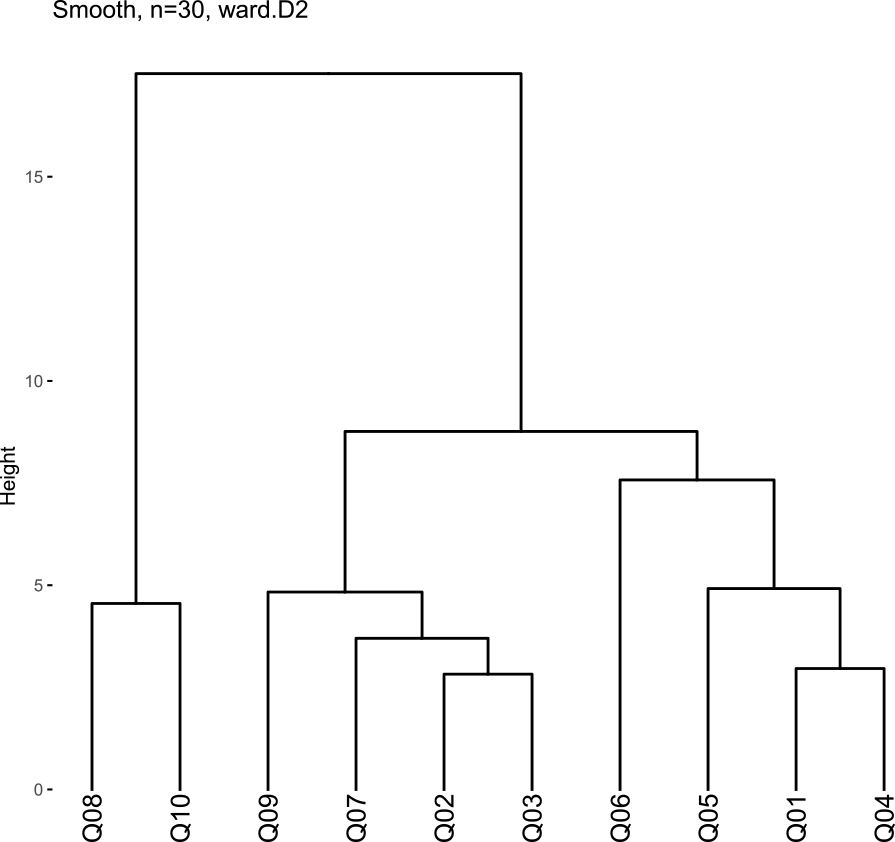
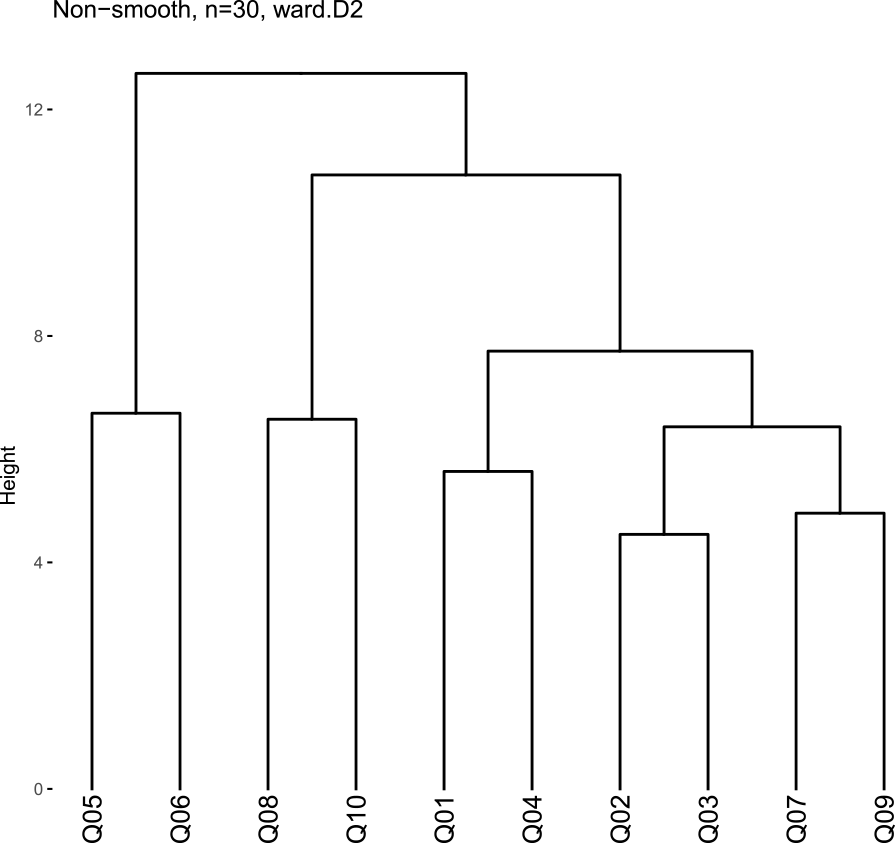
The questions about the robot's conversational skills, Q01 and Q04, belong to the same cluster when the conversation is smooth and not. When interpreted in conjunction with the histogram, this gives the impression that the robot understands the language well when the conversation is smooth and not so well when it is not smooth.
Q02, Q03, Q07, and Q09 form clusters of questions about the impressions they receive from the conversation. It shows that positive emotions, such as happiness and joy, tend to be higher when the conversation is smooth. On the other hand, questions about negative impressions such as sadness and anger, Q08 and Q10, tend to be higher when conversations are not smooth; Q08 and Q10 form the same cluster when conversations are smooth and when they are not.
4.5 Statistical Hypothesis Testing
Using VAS, it is possible to measure subjective evaluations as real values on the interval [0, 1] instead of stepped values, and the range of analysis methods has been expanded. In order to confirm the effectiveness of this method, we perform several statistical hypothesis tests. Here, we examine whether there is a significant difference between the two groups when the conversation is smooth and not. The two groups can be treated as paired data.
First, we test whether the measurements in this study follow a normal distribution or not. Whether or not the data obtained are normative is important, as many parametric test methods assume that the data under test follow a normal distribution.
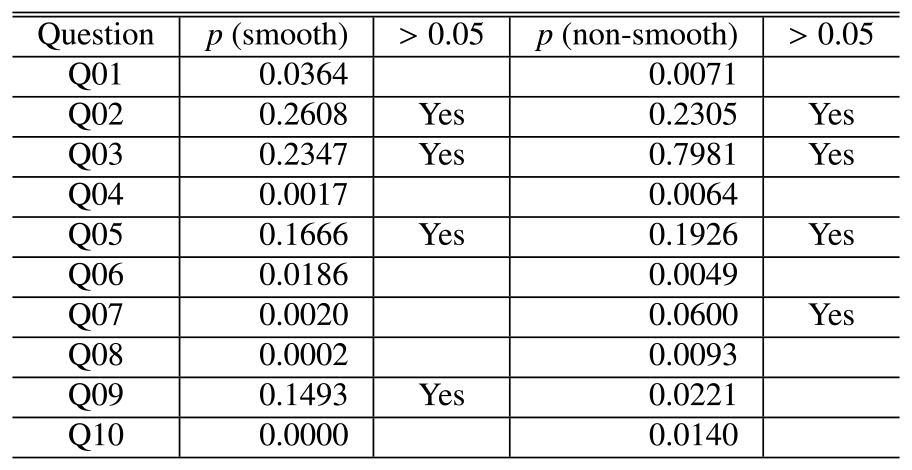
The Shapiro-Wilk test was performed to test the null hypothesis that the data were sampled from a population that follows a normal distribution. In this experiment, 30 subjects respond to 10 questions about smooth and non-smooth conversations, each of which will yield 20 data. We tested whether the 20 data follow a normal distribution for each of them at the 5% level of significance. The p-values are summarized in Table 4. The null hypothesis of the Shapiro-Wilk test is that the sample distribution follows a normal distribution. For Q02, Q03, and Q05, the null hypothesis was adopted with a p>0.05. The measurements for these questions follow a normal distribution.
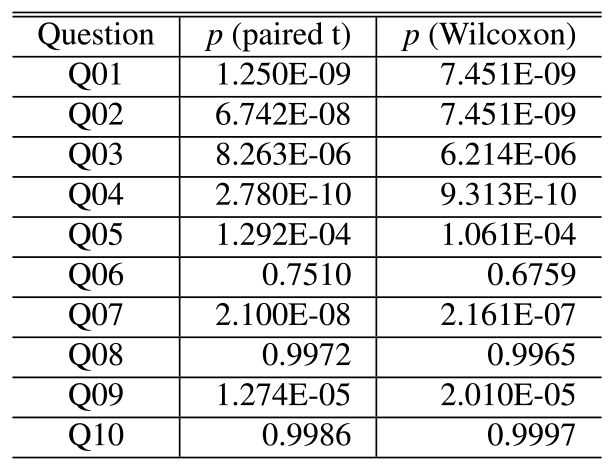
The paired t-tests were used for questions for which normality could be assumed in the obtained data, and otherwise, one-sided tests were conducted using the Wilcoxon signed-rank test, with the alternative hypothesis that the measure would be greater when the conversation was smooth than when it was not smooth. The significance level was set at 5%. The results of this test are shown in Table 5. All p-values are included for reference. The results of any of the tests resulted in p>0.05 at Q06, Q08, and Q10, and the null hypothesis is not rejected. The results show that it is more likely that the measurements for smooth conversations are not greater than those for non-smooth conversations. This result can be intuitively understood from the box plot in Fig. 5.
5. Conclusion
We conducted a subjective evaluation experiment and analysis using VAS. A newly developed VASpad records the evaluation values by tapping on the straight line presented in the app. We focused on the impressions from conversations with a talking robot and asked 30 participants to answer ten questions about when their conversations were smooth and when they were not smooth, respectively. We examine the validity of the three hypotheses proposed in section 1.2 based on the experimental results.
The sample size for this experiment was 30. With a sample size of this size, it is not difficult to plot all the data. The univariate scatter plots were drawn using beeswarm plots to show the density since the univariate scatter plots would have overlapping ties. We can visually see where the data is concentrated even outside the median from Fig. 6 and Fig. 7. Although it is self-evident, LS does not provide such distribution, and it is not possible to identify trends in the data. It is useful to plot all the data to identify rough trends when the sample size is too small to perform statistical analysis.
In this experiment, despite the small sample size of 30, we confirmed that the participants did not have a negative impression of the robot, even when the conversation was not smooth. This phenomenon can be confirmed from Q08 and Q10 in Fig. 5, and the difference from when the conversation is smooth can be visually compared. One of the advantages of VAS over LS is that it can be treated as an interval scale rather than an ordinal scale. VAS-style makes it possible to conduct more statistical tests. In the present study, we performed the paired t-test on a group of questions with guaranteed equality of variance following a normal distribution.
We give supplementary explanations of our subjective evaluation method. VAS, commonly used in medical settings to express pain, and the combination of box plots and beeswarm plots for visual representation, these methods used in this study, is a relatively common method. We have created a new subjective evaluation system by combining these methods, rather than replacing a method such as changing from LS to VAS. Figure 10 shows the key points of our proposed methodology.
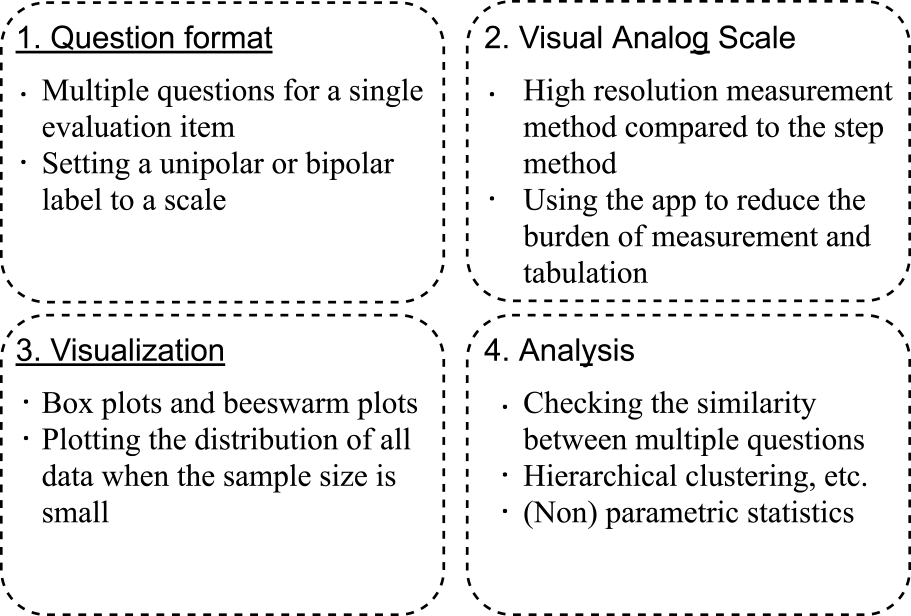
It is essential to design the question format carefully. Consideration should be given to setting multiple questions for a single item. Whether the label to be given to the scale should be bipolar or unipolar should be considered. In the present experiment, we confirmed that subjects' ratings of sadness and anger did not increase even though the conversation was not smooth. These results were obtained from questions Q08 and Q10, both of which were given unipolar labels. It is also essential to check the similarity and correlation of the answers obtained for each of the multiple questions. Hierarchical clustering can be used to identify similar groups of questions.
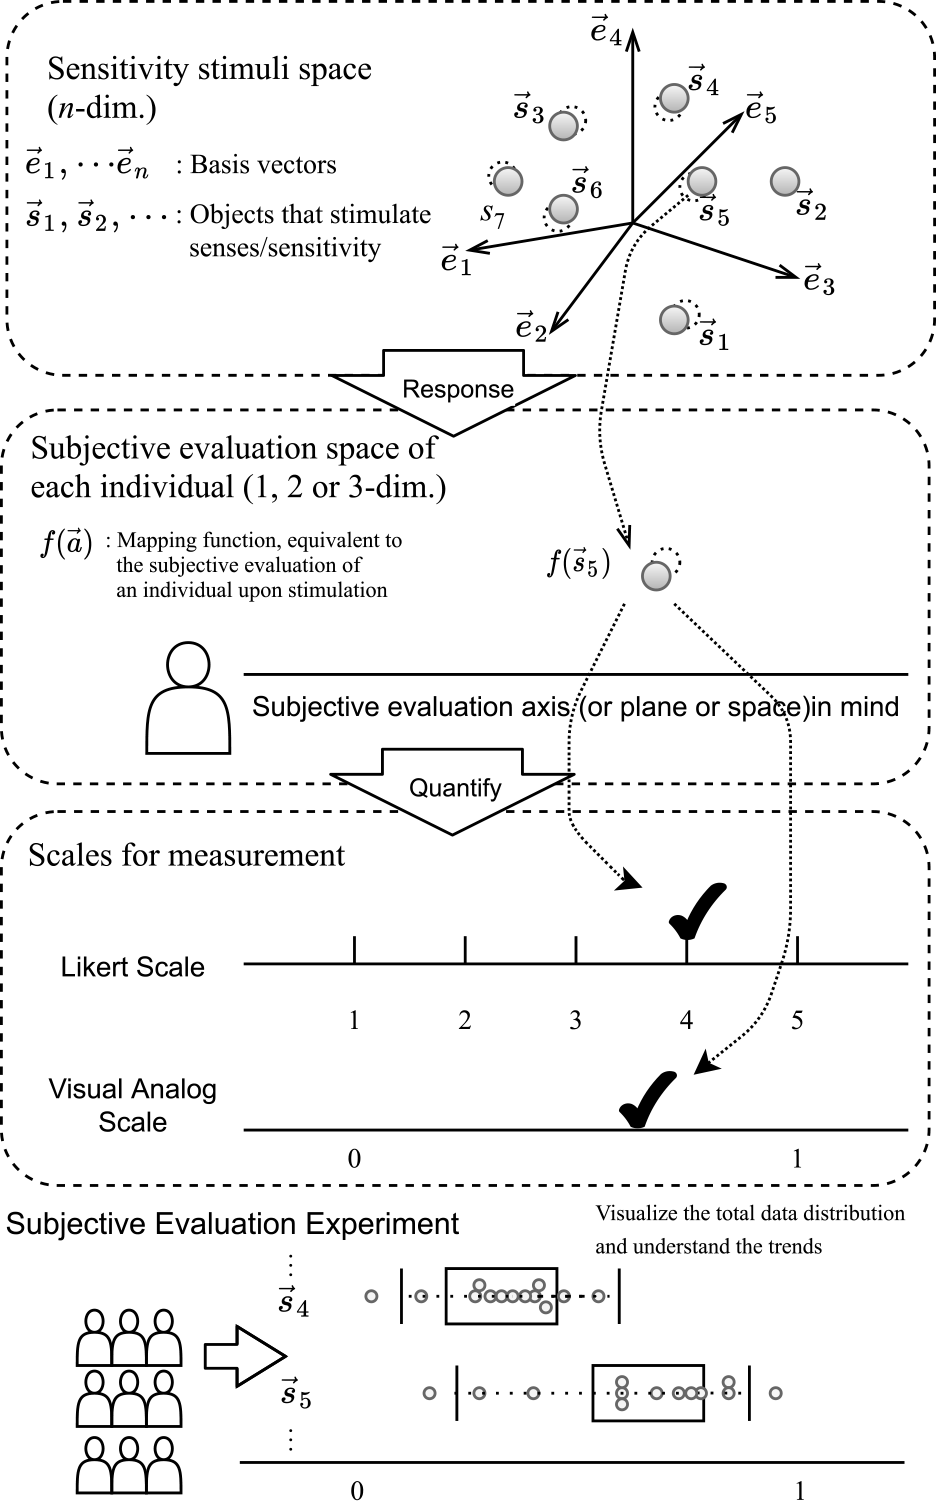
Finally, we describe our proposed subjective evaluation model using the conceptual model shown in Fig. 11. The subjective evaluation object is assumed to exist in n-dimensional vector space as an object that provides sensory and emotional stimulation. It is assumed that this object stimulates an individual and that the response generates subjectivity in the individual. In this model, subjective evaluation is equivalent to quantifying an individual's subjectivity. LS and VAS's difference as a subjective evaluation can be considered a difference in quantification or measurement resolution precision. Ways to improve the reliability of the analysis results include increasing the sample size or the measurement's accuracy; however, in cases where it is impossible to obtain a large enough sample size due to insufficient time and budget for the survey, or where the number of subjects is small, to begin with, the use of VAS should be considered.
While we have discussed VAS's usefulness in this paper, we believe that LS can also be useful. LS can also be used as a simplified VAS by increasing the number of its scale. For example, if the subject's lack of cognitive ability makes the use of the VAS difficult, or if the use of the LS provides a sufficient sample size, we should use the LS. In conclusion, we should use VAS and LS depending on the situation.
As described above, we propose a new method of subjective evaluation based on the VAS. To quantify the impressions that people receive from sensory and emotional stimuli, we believe that an intuitive evaluation method, in which a single point describes the degree of an impression on a straight line, is more effective than a numerical or verbal step-by-step evaluation method. We will continue to conduct experiments using the proposed method for various sensibilities and improve the proposed method and model.
References
- [1] Inoue, M. F. and Yamada, S.: The relationship between sample size of a test and the Likert scale levels in producing statistically meaning results for critical care research for nursing, Journal of Kochi Women's University Academy of Nursing, Vol.39, No.1, pp.17–25 (2013) (in Japanese), 〈http://id.nii.ac.jp/1299/00000168/〉.
- [2] Phelps, L., Schmitz, C. D. and Boatright, B.: The Effects of Halo and Leniency on Cooperating Teacher Reports Using Likert-Type Rating Scales, The Journal of Educational Research, Vol.79, Issue 3, pp.151–154 (1986).
- [3] Weissgerber, T.L., Milic, N.M., Winham, S.J. and Garovic, V.D.: Beyond Bar and Line Graphs: Time for a New Data Presentation Paradigm, PLoS Biol, Vol.13 No.4 (2015), DOI:10.1371/journal.pbio.1002128.
- [4] Reips, UD. and Funke, F.: Interval-level measurement with visual analogue scales in Internet-based research: VAS Generator. Behavior Research Methods, Vol.40, pp.699–704 (2008), 〈https://doi.org/10.3758/BRM.40.3.699〉.
- [5] Bishop, P. A. and Herron, R. L.: Use and Misuse of the Likert Item Responses and Other Ordinal Measures, International journal of exercise science, Vol.8, No.3, pp.297–302 (2015).
- [6] Shirahama, N., Watanabe, S., Nakaya, N. and Mori, Y.: A Proposal for Subjective Evaluation Method in Small Sample using Visual Analog Scale, Proceedings of 7th ACIS International Conference on Applied Computing & Information Technology (ACIT2019, ACM Digital Library), pp.51–56 (2019), 〈https://doi.org/10.1145/3325291.3325365〉.
- [7] Watanabe, S., Shirahama, N., Nakaya, N., Matsumoto, Y. and Mori, Y.: An Expression of the Impression of Three Pieces of Sounds Based on Visual Analog Scale Analysis, International Journal of Biomedical Soft Computing and Human Sciences, Vol.24, No.2, pp.75–82 (2019).
- [8] Shirahama, N., Murakami, K., Watanabe, S., Nakaya, N. and Mori,Y.: Subjective Evaluation Experiment of Grayscale Color to Examine VAS Measurement Method, Proceedings of the 7th IIAE International Conference on Intelligent Systems and Image Processing 2019 (ICISIP2019), pp.147–153 (2019).
- [9] Watanabe, S., Tsuruta, T., Shirahama, N., Nakaya, N., Matsumoto, Y., Tsukamoto, H. and Mori, Y.: Expression of Subjective Evaluation for the Participation Attitude to the Internet of Male College Students Based on Visual Analog Scale, Journal of the Institute of Industrial Applications Engineers, Vol.8, No.1, pp.16–23 (2020).
- [10] Myles, PS., Troedel, S., Boquest, M. and Reeves, M.: The pain visual analog scale: is it linear or nonlinear?, Anesth Analg, Vol.89, No.6, pp.1517–1520 (1999), DOI:10.1213/00000539-199912000-00038.
- [11] Yeung, A. W. K. and Wong, N. S. M.: The Historical Roots of Visual Analog Scale in Psychology as Revealed by Reference Publication Year Spectroscopy, Frontiers in Human Neuroscience 13 (2019), DOI:10.3389/fnhum.2019.00086.
- [12] Lewis, J. R. and Erdinç, O.: User Experience Rating Scales with 7, 11, or 101 Points: Does It Matter?, Journal of Usability Studies, Vol.12, Issue 2, pp.73–91 (2017).
- [13] Watanabe, S., Shirahama, N., Tsukamoto, H., Matsumoto, Y., Nakagawa, M., Miyamoto, K., Nakaya, N., Tomita, M. and Mori, Y.: Trend of the Subjective Evaluation Based on Visual Analog Scale and Likert Scale, ICIC Express Letters, Part B: Applications, Vol.7, No.1, pp.37–42 (2016).
- [14] Shirahama, N., Watanabe, S., Ikegami, F. and Mori, Y.: Development of VAS App to Improve Youth Mental Health Research Environment, ICIC Express Letters, Part B: Applications, Vol.7, No.9, pp.1939–1944 (2016).

Naruki Shirahama naruki@kct.ac.jp
Naruki Shirahama received his Ph.D. degree from Kyushu Institute of Technology in 2000. He has been working as a professor at National Institute of Technology (KOSEN), Kitakyushu College. His current research interest is the application of the subjective observation model. He is a member of IPSJ, IEEE, BMFSA, IIAE, J-SOFT, JSWE, JSKE, and JSAI.

Satoshi Watanabe
Satoshi Watanabe received his Ph.D. degree in information system from University of East Asia, Shimonoseki, in 2008. He is currently an associate professor at School of Health Sciences at Odawara, International University of Health and Welfare. His current research interests are informatics, human science and educational technology. He is a member of IPSJ, IIAE, BMFSA, JSET and so on.

Kenji Moriya
Kenji Moriya received his Ph.D. degree in engineers from Muroran Institute of Technology in 2001, and is presently a Professor at National Institute of Technology (KOSEN), Hakodate College. His current research interest is development of a bio-signal measurement and its signal processing system. He is a member of BMFSA, IIAE, JSWE, JSEE, and IEICE.

Kazuhiro Koshi
Kazuhiro Koshi received his Ph.D. degree from Toyohashi University of Technology, Japan, in 1999. He was a Research Associate in the Department of Information and Computer Sciences, Toyohashi University of Technology, Japan, until 1998. He is currently Professor in the Department of Human-Oriented Information System Engineering, National Institute of Technology, Kumamoto College, Japan. His research interests include Kansei information engineering and multimedia technologies. He is a member of IEICE, HIS, and JSWE.

Keiji Matsumoto
Keiji Matsumoto received Doctor Degree from Fukuoka University in 2010. He is currently a professor in National Institute of Technology (KOSEN), Kitakyushu College. His research interest covers the development of relaxation equipment, and biological reactions in a comfortable environment. He is a member of IIAE.
再受付日 2020年11月4日/2020年12月25日
採録日 2021年1月25日
会員登録・お問い合わせはこちら
会員種別ごとに入会方法やサービスが異なりますので、該当する会員項目を参照してください。