Field Trial of Driver Management Application with Wearable Vital Sensor
1.Introduction
In IoT (Internet of Things) is the technology to attach communication functions to physical things, connect these things to networks, and analyze their data to enable automatic control of them. IoT application areas range from manufacturing, supply chain, and maintenance, which Industrie 4.0 [1] and so on [2][3] target, to health care, agriculture, and energy.
To utilize IoT data, IoT platforms have been created to develop and operate IoT applications effectively. AWS (Amazon Web Services) IoT [4] analyzes IoT data on the cloud by integrating several Amazon Web Services. For example, Amazon Kinesis collects and delivers IoT data by the MQTT (MQ Telemetry Transport) protocol to the cloud, and Amazon Machine Learning analyzes those data by using machine learning algorithms. To integrate IoT data and other services, there are service coordination technologies such as Web Services composition technologies [5]-[14].
In manufacturing or maintenance, there are applications of appropriate time maintenance actions on the basis of monitored business machine statuses (e.g., KOMTRAX [15]), however, realtime actions based on workers' analyzed vital data have not yet been considered sufficiently. Of course, there are applications to show daily statistical information such as calorie consumption using wearable sensor data such as the amount of movement acquired by a wristband sensor, however, vital data have not been able to be utilized to take real-time actions.
There are three main reasons for this situation. The first is proper use of analysis methods of stream processing, micro batch processing and batch processing. The second is network cost to transfer vital data to the cloud. The third is insufficient backend system coordination to take real-time actions.
To overcome these challenges, in this paper, we propose a transportation driver management application (DMA) that resolves the three problems on the basis of an open-source Horton Works Data Platform (HDP) [16] architecture to utilize vital data. DMA collects a driver’s vital data in an electrocardiograph (ECG) and acceleration from a wearable vital sensor hitoe [17] and analyzes them on smart phones or the cloud to extract posture, fatigue level. DMA can take real-time actions such as alerts or assigning substitute drivers on the basis of analyzed dangerous driving, fatigue level. In Japan in January, 2016, 15 passengers died when a long-distance bus crashed [18]. Thus, bus companies need to improve safety by having drivers wearable sensors because fatigued bus drivers may cause accidents. We implemented DMA and conducted a field trial from October to November, 2016 to demonstrate its effectiveness.
The rest of this paper is organized as follows. In Section 2, we review existing IoT technologies. In Section 3, we propose and design a vital data utilization application, DMA, which resolves existing problems. In Section 4, we describe a field trial of DMA in Fukui prefecture. We summarize the paper in Section 5.
2.Overview of IoT data technologies
This section introduces existing IoT platforms and wearable sensors for IoT vital data analysis applications.
AWS IoT [4] and Azure IoT services [19] are major IoT platforms. AWS IoT can integrate each service of Amazon Web Services for IoT processing flow.
NTT DOCOMO and GE released an IoT solution in 2015 that provides GE's industrial wireless router Orbit with NTT DOCOMO’s communication module [20]. By setting up Orbit, companies can collect operation statuses of facilities. Moreover, companies can develop IoT applications on the Toami [21] platform.
IoT data analysis of stream processing such as Storm [22] or Spark Streaming [23] has become more popular, though batch processing such as MapReduce [24] has been more common conventionally. Stream processing of IoT data enables real-time situation changes to be grasped. HDP [16] is a data processing platform with all open-source software mainly using Hadoop [25]. Users can analyze data by Storm, Spark, MapReduce or so on and can store data to HBase, Hive, or so on.
Wearable terminals have spread as sensors for vital data. These terminals can be in the form of watches, wristbands, eyeglasses, T-shirts, and so on. Hitoe [17] is a T-shirt type wearable sen sor that NTT and Toray developed and can collect ECG data and three-axis acceleration data via a smart phone.
In this way, platforms and sensors for vital data analysis have been progressing. However, when we consider utilizing vital data and taking real-time actions such as substitute worker assignment, existing technologies have some problems.
In AWS IoT, to analyze IoT data, users need to upload all data to the cloud and need the network cost for many sensors. When users analyze collected data, Amazon Machine Learning, Lambda, or other services on the cloud are used. However, how to use each service for analyzing huge continuous vital data has not been considered sufficiently.
Applications developed on Toami mainly visualize collected data by batch processing. Therefore, applications that take realtime actions such as repair parts orders on the basis of analysis are not considered.
Though there are technologies for micro batch processing or stream processing such as Spark and Storm, current typical applications are sequential data analysis of SNS posts or operation logs. There are few applications for vital data analysis, and the proper way to extract necessary data has not been discussed sufficiently.
Here, we summarize existing problems. The first is proper use of analysis methods. To utilize vital data in real-time, not only batch processing but also stream processing for continuous data and micro batch processing for bulk data of short period are needed. In other words, various time scales analysis are needed. However, application of various time scales analysis to monitoring workers' health has not been considered sufficiently on existing IoT platforms. The second is network cost. Because vital data are continuously generated, the bandwidth to transfer them to the cloud is large. We need to reduce network cost for vital data analysis. The third is insufficient backend system coordination to take real-time actions. For example, to assign substitute workers on the basis of analyzed vital data results, we need to coordinate human resource assignment systems or ERP in real time.
3.Proposal of driver management application that resolves existing problems
In this section, we propose our vital data utilization application, DMA, which resolves the existing three problems. In 3.1, we explain approaches to resolve these problems. In 3.2, we describe the system design of DMA to analyze vital data on the basis of HDP.
3.1 Approaches to resolve existing problems
DMA collects drivers' vital data via hitoe, analyzes them, and stores them on the cloud. DMA shows all drivers' health statuses on a one screen and checks for dangerous driving and fatigue level change.
To resolve existing three problems, we propose three ideas for DMA. Note that each idea does not fully correspond to each problem.
The first is semi real-time analysis of fatigue level by micro batch processing of vital data using Spark Streaming on the cloud. The second is stream processing of hitoe data on smart phones to extract primary processed data from raw data and detect driving posture.
The third is backend system coordination via an in-memory database (DB) for prompt actions such as substitute driver assignment.
These three ideas provide advantages.
Smart phones only send primary processed data (e.g., heartbeat R-wave R-wave interval: RRI) from huge continuous data (e.g., ECG) to the cloud. This can reduce network cost. Smart phones also analyze posture in stream processing and can send alerts of dangerous postures during driving such as looking away or picking things up within a few seconds even if a mobile network is disconnected.
The cloud analyzes bulk primary processed data in a short period (e.g., one-minute RRI data) and extracts analyzed data such as fatigue level from primitive data in sufficiently short time. Because analyzing fatigue requires complex analyzing logic, the rich computation resources of the cloud are utilized. For high accuracy analysis, analysis of bulk data with a certain period is needed. Therefore, we adopt micro batch processing, which repeats storing and analyzing data in a short period.
Analyzed data are stored in an in-memory DB. Because an in-memory DB can process faster than a disk DB, it enables a transportation company can take prompt actions. For example, when the fatigue level of a driver exceeds a certain threshold, caution information is sent to company operators or a substitute longdistance bus driver is assigned by coordinating backend systems such as enterprise resource planning (ERP) or human resource (HR) management functions.
Here, we summarize solutions of existing problems by DMA. For proper use of analysis methods, smart phones take stream processing of raw data to detect posture and the cloud takes micro batch processing of RRI data to extract fatigue level. For network cost, smart phones send primary processed data to the cloud to reduce data amount. For insufficient backend system coordination, real time actions can be made to coordinate ERP via in-memory DB which does not need long time batch processing.
3.2 Design of Driver Management Application
Figure 1 shows a system image based on the above ideas. Fig.1 also shows processing steps of vital sensor data analysis using HDP where sensor stream data are analyzed by Spark Stream ing and analyzed data are stored to HBase [26]. Though HDP provides various modules of open-source software such as batch processing, we only use modules for target micro batch processing for analyzed data from primitive vital data. HDP can be built on cloud resources by cloud middleware such as OpenStack using an agile method. (e.g. cloud services using OpenStack [27][28], cloud resources evaluations [29], and development method evaluations on cloud [30][31])
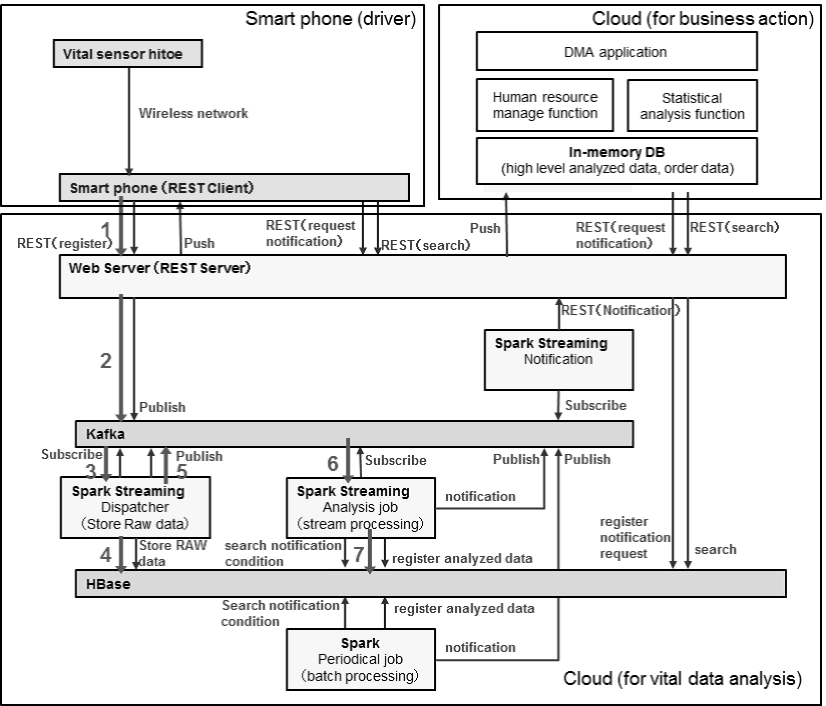
Each driver wears a hitoe T-shirt that sends the driver's vital data to a smart phone. A smart phone analyzes hitoe data by stream processing to extract primary processed data of RRI from the ECG and posture from acceleration and sends them to the cloud via REST style. This analysis can be done by hitoe SDK [32] and posture estimation technology. Because the ECG has huge raw data, primary processed data such as RRI are sent to the cloud. If smart phones detect dangerous postures such as looking away or picking things up during driving, smart phones may notify drivers by alerts. Because posture estimations are used for emergency alerts, they need to be analyzed within a few seconds. We confirmed that smart phones could analyze posture data sufficiently quickly even if a network is disconnected.
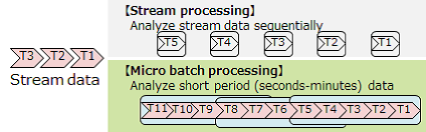
Vital data are sent to the cloud, and collected data are delivered by a messaging system, Apache Kafka, by a publish/subscribe method. A Spark Streaming Dispatcher subscribes collected data to Kafka. The Dispatcher stores acquired data to HBase and publishes cleansed data to Kafka. Spark Streaming Analysis Job subscribes cleansed data to Kafka. The Analysis Job analyzes cleansed datasets that have a defined window size in micro batch processing and extracts fatigue level. Figure 2 shows a comparison of stream processing and micro batch processing. Spark Streaming adopts micro batch processing and it analyzes short period data such as several seconds to several minutes. Window sizes of micro batch are configurable for each extracted data type. Fatigue level is calculated using RRI fluctuation change with a one-minute window size. Bus operators want to check drivers' fatigue levels regularly, so they desire to see continuous fatigue data within 10 seconds from the request click. Especially, to continuously show data without one-minute intervals, we process multiple windows with small time-shifted datasets in parallel. Lastly, analyzed data are stored to HBase.
Here, we explain the fatigue estimation method. It is said that when central nervous systems such as brains become tired, fluctuations of RRI become smaller. Therefore, NTT previously proposed to estimate fatigue from heartrate on the basis of training data of RRI fluctuations change and the central nervous system's fatigue change [33][34]. We applied this method for drivers' fatigue estimation of DMA. For training data, we collected dozens sample data of drivers who drove on a course. Drivers' heartrate data were continuously collected by heartrate sensors. Drivers also measured flicker values with a flicker measuring machine every several tens of minutes while driving. The flicker value is an index of a central nervous system's fatigue. Because this method estimates fatigue on the basis of learning, estimation accuracy depends on number of training data and is not 100%.
Analyzed data such as fatigue level are reflected from HBase to in-memory DB via REST API. Using these data, transportation companies can monitor visualization data of drivers' statuses and take actions on the basis of situation changes. Figure 3 shows a screen image of DMA. When we add sensor data other than those for hitoe, we can use cloud configuration technologies using OpenStack Heat and Ironic [35] and automatic VM regression test technologies [36] for configuration change. If we need computation power to extract analyzed data, we can use a graphics processing unit (GPU) to compute by heterogeneous cloud deployment technologies such as [37][38][39] using CUDA[40], OpenCL[41] or OpenACC [42] with PGI compiler [43].
As an example business action, a substitute driver is assigned in real time using a HR management system when a driver's reaches a dangerous fatigue level for driving. Here, we explain backend system coordination (There are some examples of backend system coordination, factory maintenances, for vehicle maintenance and for security). From data in an in-memory DB, predictions of drivers' health statuses and substitute driver necessity are judged on the basis of time change of fatigue. To predict future fatigue, statistical calculation software can be used. On the basis of these predictions, if a substitute driver is needed, order data for driver assignment is inserted to the in-memory DB. A HR management system such as Success Factors assigns a substitute driver in accordance with inserted orders. Service coordination using Web services [44][45] can be used to coordinate outer systems.
4.Field trial of Driver Management Application
In this section, we give an outline and the results of a DMA field trial with the Keifuku Bus Company in Fukui Prefecture, Japan. We implemented DMA using Spark Streaming and HBase. In addition, we used a smart phone (Sony Xperia Z5) to send hitoe data to the cloud. There are two types of hitoe: medical use hitoe and general use hitoe. Because we used general use hitoe in this field trial for bus driver management, we regarded that this trial was not a medical research. Therefore, we followed results of company-internal privacy assessment such as to keep personal information protection policy with Keifuku Bus Company, and not medical ethical guidelines.
4.1 Outline of field trial
We conducted the field trial from October to November, 2016. About 15 bus drivers participated the trial and wore hitoe. DMA acquired vital data during bus driving and analyzed the data on the cloud. There were three types of buses (long-distance, community, and regular route buses), and drivers of all types participated in the trial.
The trial objectives were to verify the real time analysis feasibility, validity of analysis of fatigue estimation, network cost reduction, stability of vital data acquisition by hitoe, daily operation load, and availability of DMA.
Bus companies want to visualize statuses of community bus drivers to check for overwork risk and to see whether long distance bus drivers recover from fatigue by taking a break or changing to a substitute driver. Therefore, in addition to technical verification, we also analyzed the visualization of each bus driver status such as fatigue level and nerve level which is calculated by Cardiac vagal index (CVI) from heartrate data for the bus company.
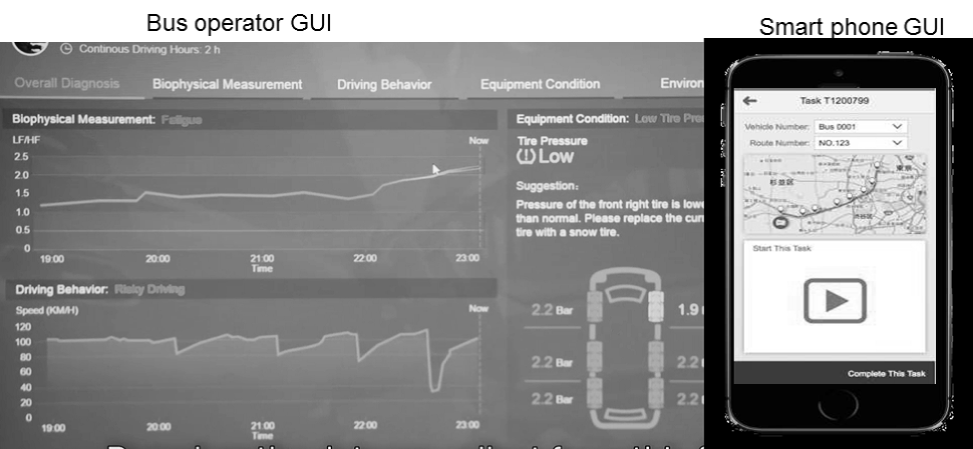
Here, we explain the daily operation. Every morning, a driver wore a washed hitoe and linked it to a smart phone. The smart phone acquired the driver's vital data of several minutes resting and sent it to the cloud. These data are base data to estimate fatigue level. When a driver drove a bus, he/she wore hitoe and held the smart phone. Vital data during driving were sent to the cloud and analyzed to estimate fatigue level by micro batch processing. Analyzed data were shown via a Web graphical user interface (GUI) to Keifuku Bus operation staff. The bus operation staff could check each bus location and bus driver status such as fatigue level.
Bus drivers answered questionnaires before and after driving. The questionnaire included 10 items about fatigue that could be scored from 1 to 5. The items were "I feel sleepy", "I feel frustrated", "My legs feel heavy", "I do not feel motivated", and so on.
In addition to questionnaires, we interviewed drivers about their statuses at certain times at which hitoe analyzed data showed high heartrate (e.g., more than 120 beats per minute) or other cautious cases to confirm drivers' feeling and hitoe analysis results are not so differed.
In this field trial, we did not conduct actual backend system coordination actions because each action is customer dependent.
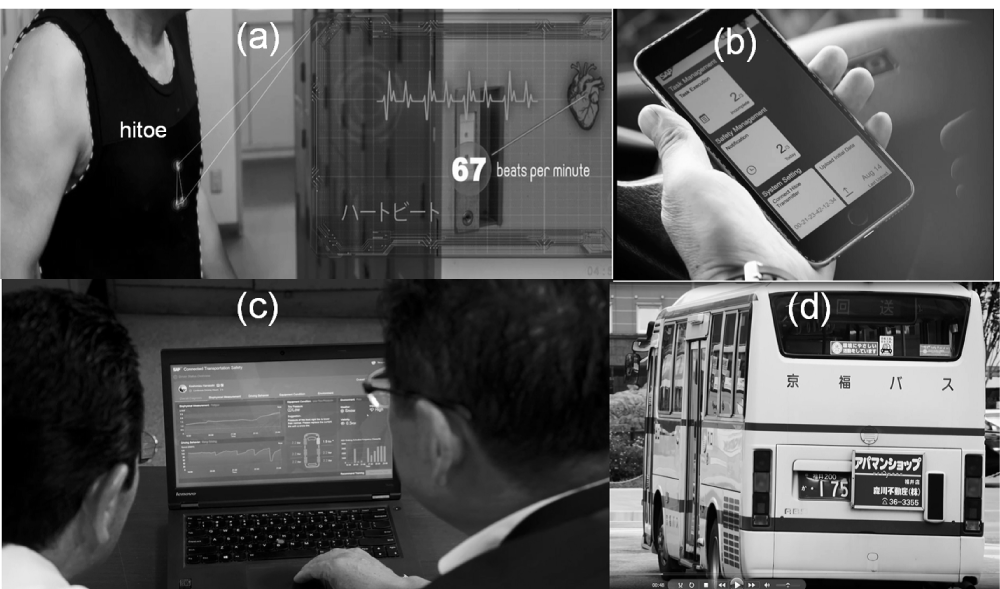
Figure 4 images show screen shots of DMA field trial. Fig.4(a) shows a driver putting on hitoe in the morning. Fig.4 (b) shows the GUI of the smart phone as watched by a driver. Fig.4 (c) shows the GUI of a PC as seen by operators. Fig.4(d) shows a Keifuku bus driven by a hitoe wearing driver.
4.2 Evaluation through field trial
In this subsection, we review verification items through the two-month field trial. Hitoe vital data are private information of drivers, so we cannot show hitoe data or analyzed data such as fatigue level in the paper. However, our DMA acquired drivers' hitoe data and analyzed them continuously through the field trial. Regarding real time analysis feasibility, data could be shown within 10 seconds from the requests, so operation staff members were not frustrated at all. The window size to calculate fatigue is one minute, Spark Streaming can process each window concurrently like pipeline processing. Therefore, operation staff can see the fatigue level change continuously.
When we collected training data, we asked test drivers to check flicker values every several tens of minutes to collect correct data. However, in the field trial, bus drivers were driving buses, so we could not ask them to check flicker values. Therefore, we did not improve fatigue estimation precision in pre-verification, however, we confirmed that analyzed fatigue and drivers' feelings did not differ much by comparing fatigue level analyzed from hitoe data and drivers answers of questionnaires and interviews.
Regarding network cost, we could greatly reduce vital data transfer. Because hitoe outputs ECG value every 5 msec, 12,000 data are generated for each driver every minute. When ECG data are sent to the cloud, 1.6 MB is sent per minute. On the other hand, when compressed primary processed data are sent such as RRI by smart phones, only 7 kB is sent per minute. In this way, our proposal of stream processing on a smart phone and micro batch processing on the cloud can reduce network cost and the size of data stored in the cloud. In the field trial, although about 10 drivers drove buses concurrently, we could handle their data without problem.
Regarding stability of vital data acquisition by hitoe, some drivers had skin so dry that vital data could not be acquired. We resolved this by wetting hitoe. Wearing hitoe did not cause drivers any particular trouble, although several minutes of rest status monitoring increased their work time slightly. Regarding DMA availability, the service did not stop.
Through this trial, we confirmed that processing data of (semi) real-time various time scales to analyze continuous fatigue level data by micro batch processing on the cloud within 10 seconds and posture by stream processing on smart phones within a few seconds. We also confirmed to reduce network cost by sending compressed data that had been primarily processed on smart phones and business operation feasibility of a bus company's daily operation.
Then, we review discussion items with Keifuku Bus Company. In the trial, it is likely said that drivers' nerve levels are high when buses are late from the timetables. Therefore, it may be better that bus companies change strict timetables of buses. From fatigue analysis of long distance bus drivers, it is also said that nap is good for fatigue level recovery. In a long distance bus, there are two drivers to change driving periodically. Before the trial, Keifuku Bus Company wondered that a long distance bus driver takes rest sufficiently or not. Through the trial, it is analyzed that long distance bus drivers recovered their fatigue level after nap from hitoe data. However, we should be careful when hitoe data detects that fatigue level is not recovered sufficiently after rest time.
4.3 Consideration points for production services
In this field trial, main purpose is confirming real time processing for amount of vital data to monitor drivers statuses and take next actions promptly. Therefore, we run Spark on baremetal servers to reduce risks of server performance problems. However, for production services, we need to consider cost for bus companies. To reduce operation and initial cost, Virtual Machines are used for Spark running, and hitoe wears are rented for bus drivers. Although a set of hitoe wear and transmitter is more than 10,000 yen, a hitoe wear can be washed by washing machines more than several hundred times. Thus, we can rent hitoe wear certain months for drivers, and drivers can wash hitoe wears by themselves.
Of course, we cannot say hitoe monitoring prevent fatal accidents perfectly. This trial only helps to visualize drivers' health statuses of fatigue. For production services, appropriate actions based on monitoring results are needed by coordinating backend systems. For example, fatigue level is higher than a threshold value, alert mails or calls are sent and a substitute driver is assigned. To assign human resources, ERP or human resource management functions are used. There is also an action that bus companies change bus timetables of routes on which drivers' nerve levels are higher than normal values.
Existing IoT platforms such as AWS IoT or Azure IoT Services also support real-time processing such as stream data processing, however, proper use of stream/micro-batch processing, network cost reduction, and backend system coordinations for vital data has not been discussed sufficiently. Our DMA mainly targets and resolves these problems as mentioned.
5.Conclusion
In this paper, we proposed a transportation driver management application (DMA) that resolves existing problems on the basis of Horton Works Data Platform (HDP) architecture to utilize vital data for real-time actions.
DMA has three characteristics. The first is semi real-time analysis of fatigue by micro batch processing of vital data using Spark Streaming on the cloud. The second is stream processing of raw vital data on smart phones. This can reduce network cost to filter huge electrocardiograph (ECG) data and can report dangerous driving posture immediately. The third is backend system coordination via an in-memory database (DB) that enables various actions such as assigning substitute drivers. DMA can manage driver health information in real-time with low cost and can take real-time actions such as alerts and substitute driver assignment.
We implemented DMA using Spark Streaming and HBase and conducted a field trial with the Keifuku Bus Company from October to November, 2016. Through the field trial, we demonstrated the feasibility of real-time monitoring of hitoe data analysis.
In near future, we plan to improve DMA on the basis of results of the field trial and to study quantitative business merits such as accident reduction or cost reduction. We also plan to propose DMA to other industries because common functions of micro batch processing in HDP and backend system coordination via an in-memory DB can be used for not only driver management but also other applications.
Acknowledgments We really appreciate Keifuku Bus Company for cooperation of the field trial.
References
- 1) Hermann, M., Pentek, T. and Otto, B. : Design Principles for Industrie 4.0 Scenarios, Working Draft, Rechnische Universitat Dortmund, (2015) https://www.thiagobranquinho.com/wp-content/uploads/2016/11/Design-Principles-for-Industrie-4_0-Scenarios.pdf
- 2) Tron Project Web Site, http://www.tron.org/
- 3) Evans, P. C. and Annunziata, M. : Industrial Internet : Pushing The Boundaries of Minds and Machines, Technical Report of General Electric (GE), (Nov. 2012) http://www.ge.com/docs/chapters/Industrial_Internet.pdf
- 4) AWS IoT Platform Website, https://www.amazonaws.cn/en/iot-platform/
- 5) Yamato, Y., Tanaka, Y. and Sunaga, H. : Context-aware Ubiquitous Service Composition Technology, The IFIP International Conference on Research and Practical Issues of Enterprise Information Systems (CONFENIS 2006), pp.51-61, (Apr. 2006).
- 6) Sunaga, H., Yamato, Y., Ohnishi, H., Kaneko, M., Iio, M. and Hirano, M. : Service Delivery Platform Architecture for The Next-Generation Network, ICIN2008, Session 9-A (2008).
- 7) Yamato, Y., Ohnishi, H. and Sunaga, H. : Development of Service Control Server for Web-Telecom Coordination Service, IEEE International Conference on Web Services (ICWS 2008), pp.600-607 (Sep. 2008).
- 8) Yokohata, Y., Yamato, Y., Takemoto, M. and Sunaga, H. : Service Composition Architecture for Programmability and Flexibility in Ubiquitous Communication Networks, IEEE International Symposium on Applications and The Internet Workshops (SAINTW’06), pp.145-148 (Jan. 2006).
- 9) Takemoto, M., Yamato, Y. and Sunaga, H. : Service Elements and Service Templates for Adaptive Service Composition in a Ubiquitous Computing Environment, The 9th Asia-Pacific Conference on Communications (APCC2003), Vol.1, pp.335-338 (Sep. 2003).
- 10) Yamato, Y., Ohnishi, H. and Sunaga, H. : Study of Service Processing Agent for Context-Aware Service Coordination, IEEE International Conference on Service Computing (SCC 2008), pp.275-282, (July 2008).
- 11) Yamato, Y., Nakano, Y., and Sunaga, H. : Study and Evaluation of Context-Aware Service Composition and Change-Over Using BPEL Engine and Semantic Web Techniques, IEEE Consumer Communications and Networking Conference (CCNC 2008), pp.863-867 (Jan. 2008).
- 12) Sunaga, H., Takemoto, M., Yamato, Y., Yokohata, Y., Nakano, Y. and Hamada, M. : Ubiquitous Life Creation Through Service Composition Technologies, World Telecommunications Congress 2006 (WTC2006) (May 2006).
- 13) Nakano, Y., Yamato, Y., Takemoto, M. and Sunaga, H. : Method of Creating Web Services from Web Applications, IEEE International Conference on Service-Oriented Computing and Applications (SOCA 2007), pp.65-71, (June 2007).
- 14) Yokohata, Y., Yamato, Y., Takemoto, M., Tanaka, E. and Nishiki, K. : Context-Aware Content-Provision Service for Shopping Malls Based on Ubiquitous Service-Oriented Network Framework and Authentication and Access Control Agent Framework, IEEE Consumer Communications and Networking Conference (CCNC 2006), pp.1330-1331 (Jan. 2006).
- 15) Arakawa, S. : Development and Deployment of KOMTRAX Step 2, Komatsu Technical Report Vol.48, No.150 (2002).
- 16) Hortonworks Data Platform Website, https://hortonworks.com/
- 17) Tsukada, S., Nakashima, H. and Torimitsu, K. : Conductive Polymer Combined Silk Fiber Bundle for Bioelectrical Signal Recording, PLoS ONE, Vol.7, No.4, pp.e33689 (2012).
- 18) Bus Accident News, https://www.japantimes.co.jp/news/2016/01/15/national/night-ski-bus-flips-karuizawa-three-killed-11-critical-condition/#.XJRG2BP7Tyt
- 19) Microsoft Azure IoT Service, http://download.microsoft.com/download/F/B/0/FB093814-BECE-4B54-A898-F7B66CCAF8AF/Get_started_with_the_Internet_of_Things.pdf
- 20) NTT Docomo Press Release Website, https://www.nttdocomo.co.jp/english/info/media center/pr/2015/0708 00.html
- 21) Toami Web Site (Japanese), http://www.m2m-cloud.jp/
- 22) Marz, N. : STORM : Distributed and Fault-tolerant Realtime Computation, (2013) http://storm.apache.org/
- 23) Zaharia, M., Chowdhury, M., Franklin, M. J., Shenker, S. and Stoica, I. : Spark : Cluster Computing with Working Sets, Proceedings of The 2nd USENIX Conference on Hot Topics in Cloud Computing (2010).
- 24) Dean, J. and Ghemawat, S. : MapReduce : Simplified Data Processing on Large Clusters, In Proceedings of The 6th Symposium on Opearting Systems Design and Implementation (OSDI’04), pp.137-150 (Dec. 2004).
- 25) Shvachko, K., Kuang, H., Radia, S. and Chansler, R. : The Hadoop Distributed File System, IEEE 26th Symposium on Mass Storage Systems and Technologies (MSST2010), pp.1-10 (May 2010).
- 26) HBase Web Site, https://hbase.apache.org/
- 27) Yamato, Y., Nishizawa, Y., Nagao, S. and Sato, K. : Fast and Reliable Restoration Method of Virtual Resources on OpenStack, IEEE Transactions on Cloud Computing, DOI : 10.1109/TCC.2015.2481392 (Sep. 2015).
- 28) Yamato, Y., Nishizawa, Y., Muroi, M. and Tanaka, K. : Development of Resource Management Server for Production IaaS Services Based on OpenStack, Journal of Information Processing, Vol.23, No.1, pp.58-66 (Jan. 2015).
- 29) Yamato, Y. : OpenStack Hypervisor, Container and Baremetal Servers Performance Comparison, IEICE Communication Express, Vol.4, No.7, pp.228-232, (July 2015).
- 30) Yamato, Y., Katsuragi, S., Nagao, S. and Miura, N. : Software Maintenance Evaluation of Agile Software Development Method Based on OpenStack, IEICE Transactions on Information & Systems, Vol.E98- D, No.7, pp.1377-1380 (July 2015).
- 31) Yamato, Y., Shigematsu, N. and Miura, N. : Evaluation of Agile Software Development Method for Carrier Cloud Service Platform Development, IEICE Transactions on Information & Systems, Vol.E97-D, No.11, pp.2959-2962 (Nov. 2014).
- 32) Hitoe Transmitter SDK Web Site, https://dev.smt.docomo.ne.jp/?p=docs.api.page&api_name=iot_control_&p_name=api_usage_scenario
- 33) Chiba, A., Tsunoda, K., Chigira, H., Ura, T., Mizuno, O. and Tanaka, T. : Estimating Critical Fusion Frequency from Heart Rate Variability, EMBC2015 (Aug. 2015).
- 34) Chiba, A., Tsunoda, K., Chigira, H., Ura, T., Mizuno, O. and Tanaka, T. : Study of Estimating Critical Flicker Frequency from Heart Rate Variability, IEICE technical report, 115.149 (HIP2015-43), pp.7-12, (in Japanese) (July 2015).
- 35) Yamato, Y. : Performance-Aware Server Architecture Recommendation and Automatic Performance Verification Technology on IaaS Cloud, Service Oriented Computing and Applications, Springer, DOI : 10.1007/s11761-016-0201-x (Nov. 2016).
- 36) Yamato, Y. : Automatic Verification Technology of Software Patches for User Virtual Environments on IaaS cloud, Journal of Cloud Computing, Springer, 2015, 4 : 4, DOI : 10.1186/s13677-015-0028-6 (Feb. 2015).
- 37) Yamato, Y. : Optimum Application Deployment Technology for Heterogeneous IaaS Cloud, Journal of Information Processing, Vol.25, No.1, pp.56-58 (Jan. 2017).
- 38) Yamato, Y. : Server Selection, Configuration and Reconfiguration Technology for IaaS Cloud with Multiple Server Types, Journal of Network and Systems Management, Springer, DOI : 10.1007/s10922-017-9418-z (Aug. 2017).
- 39) Yamato, Y., Demizu, T., Noguchi, H. and Kataoka, M. : Automatic GPU Offloading Technology for Open IoT Environment, IEEE Internet of Things Journal (2018).
- 40) Sanders, J. and Kandrot, E. : CUDA by example : An Introduction to General-purpose GPU Programming, Addison-Wesley, ISBN-0131387685 (2011).
- 41) Stone, J. E., Gohara, D. and Shi, G. : OpenCL : A Parallel Programming Standard for Heterogeneous Computing Systems, Computing in Science & Engineering, Vol.12, No.3, pp.66-73 (2010).
- 42) Wienke, S., Springer, P., Terboven, C. and an Mey, D. : OpenACC-first Experiences with Real-world Applications, Euro-Par 2012 Parallel Processing, pp.859-870 (2012).
- 43) Wolfe, M. : Implementing The PGI Accelerator Model, ACM The 3rd Workshop on General-Purpose Computation on Graphics Processing Units, pp.43-50 (Mar. 2010).
- 44) Yamato, Y. : Ubiquitous Service Composition Technology for Ubiquitous Network Environments, IPSJ Journal, Vol.48, No.2, pp.562-577 (Feb. 2007).
- 45) Yamato, Y. and Sunaga, H. : Context-Aware Service Composition and Component Change-over Using Semantic Web Techniques, IEEE International Conference on Web Services (ICWS 2007), pp.687-694 (July 2007).
Yoji Yamato received his B. S., M. S. degrees in physics and Ph. D. degree in general systems studies from University of Tokyo, Japan in 2000, 2002 and 2009, respectively. He joined NTT Corporation, Japan in 2002. There, he has been engaged in developmental research of Cloud computing platform, Peer-to-Peer computing and Service Delivery Platform. Currently he is a distinguished researcher of NTT Network Service Systems Laboratories. He is a member of IPSJ and a senior member of IEEE and IEICE.
Makoto Nakayama(non-member)Currently, Makoto Nakayama is a senior research engineer of NTT Software Innovation Center.
Akihiro Chiba(non-member)Akihiro Chiba received the bachelor and master degrees in engineering from the University of Electro-Communications, Tokyo, Japan, in 2011 and 2013, respectively. Currently he is a researcher of NTT Service Evolution Laboratories, NTT Corporation, Japan. His current research interests include sensing.
Tomoaki Masuda(non-member)Currently, Tomoaki Masuda is a manager of Corporate Planning, NTT Communications Corporation, Japan.
Tokutarou Yoshida(non-member)Currently, Tokutarou Yoshida is a manager of Applications and Content, NTT Communications Corporation, Japan.
採録決定:2019年3月1日
編集担当:杉田 由美子