A Column Matching Method with Low Frequent Words
1.Introduction
Manufacturing industry has been paying attention to productivity improvement by incorporating the Internet of Things (IoT) concept, such as Industrial Internet [1] and Industrie 4.0 [2]. Cloud based manufacturing (CM) has been proposed as a way of achieving this aim. As one of CM services, we are considering (i) asset sharing [3,4] to match manufacturing equipment for improved equipment operation efficiency, (ii) manufacturing process design to optimize production planning and to reduce production lead times, and (iii) remote quality sensing to monitor production lines for quality management. In the asset sharing, consignors request that consignees manufacture consignors’ products with actual production data from consignees’ assets. Then the consignees transform the production data to make it readable for the consignors. A format of consignee’s data is usually different from a format as seen in consignor’s data. Therefore, we now considers utilizing a standard data format to remove the format difference. There exist various standard data models such as CMSD (Core Manufacturing Simulation Data) [5], ISA95 (International Society of Automation 95) [6] and ISO22400 (International Organization for Standardization 22400) [7], and we selected CMSD because it has columns required for asset sharing such as a column for the bill of materials (BOM) which defines relationship between parts, and a column indicating working period for resource (e.g. equipment and worker).
To transform factory data into CMSD, it is necessary to understand the data format derived from two factories, since a column name indicating equipment operation efficiency or another column name indicating a part type is usually different in each factory. This means that the factory data transformation is a laborious task. When we transformed data from our own factories into CMSD by hand, the transformation took 50 days of effort (5 people working for 10 days). In this report, we’ve worked on the reduction of data transformation cost. As a first step, to realize a sharing service in our factories, our goal is to reduce the data transformation cost by 80% in consideration of service price.
In Section 2, we describe existing column matching and its problem. And then, we show our proposed method in section 3 and evaluation of our method in section 4. Finally, in section 5, we conclude our report.
2.Column Matching
2.1 Details of Column Matching
The data transformation process generally requires six steps below to transform a factory-specific data model into a standard data model.
Step 1: Understanding of how the factory data is utilized
Step 2: Understanding of the data schema
Step 3: Understanding of how a data mart including the factory data is generated
Step 4: Understanding of how an abbreviation can be tied with its original word
Step 5: Identification of mapping destinations
Step 6: Consideration of further ETL (Extract, Transform, Load) for unit adjustment
Manual data transformation requires 1 man-day, 10 man-days, 2 man-days, 2 man-days, 30 man-days, and 10 man-days for the step1, 2, 3, 4, 5 and 6 respectively. The step2, 5 and 6 have large costs due to long time spent in comparing a large number of column pairs. Therefore, we develop a novel scheme to reduce the number of column pairs to be compared.
2.2 Introduction of Existing Method
We introduce existing methods for column matching. One existing method is a column matching method based on column features [8]. In this method, column features including column names, table names, the range of data values, and data types are extracted as the first step. Next, after calculating matching scores for each column feature on a column (referred to as “a single matching score” below), the linear sum of single matching scores is calculated to obtain a matching score of the column (referred to as “an overall matching score” below). Finally, columns whose overall matching scores exceed a threshold (referred to as “a matching score threshold” below) are recommended. Note that the weight for each single matching score and the threshold of an overall matching score are determined by the least squares method or maximum likelihood estimation using past matching results.
Another existing method [9] applies machine learning to past matching results. A problem of this method is that column matching must be performed manually when there are no past matching results. There are also crowdsource-based methods [10, 11] where the matching work is ordered by experts in the field. But ultimately these methods still require the payment of matching costs that are the same or even higher. A knowledge graph based method is one of existing methods [12]. This method uses a knowledge graph created from non-structured data such as operation documents or specification documents. However, the total costs for mapping become large as the graph creating process costs a lot. On the other hand, our proposal can match columns faster as it utilizes only meta data of structured data and does not create a knowledge graph.
2.3 Applying an existing method to real data and its problem
We found two problems when we performed the existing column matching method [8] based on column features to transform factory data to CMSD.
Problem 1: A large number of column pairs are recommended
In the factory data and CSMD, columns relating to IDs and start times frequently exist. Therefore, many column pairs are recommended by this method since the column features are similar. Then a lot of effort is needed to specify a correct column pair. For example, Figure 1 shows four IDs (Calendar, Shift, Job and Schedule) in CMSD. As recommendation candidates for the transformation destination of ID of ShiftInfo in the factory data, all the four IDs are selected since they have similar names and types. We found that this method recommended up to 153 candidates at the same time for a column matching pattern.
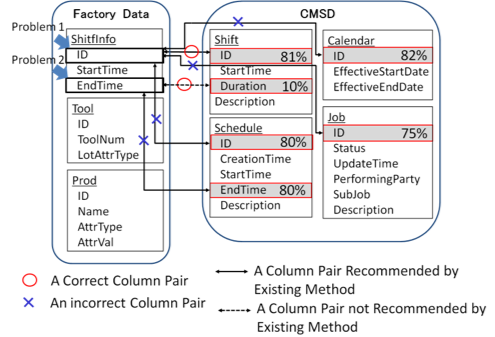
There are also cases of correct column pairs that have different data formats (table structures and/or column names). However, these column pairs cannot be recommended by the existing methods since column features such as column names, table names and data types are not similar. Therefore, they all have to be resolved by hand, resulting in large data transformation costs. For example, in Figure1, the correct transformation destination of EndTime of ShiftInfo in the factory data is Duration of Shift in CMSD. However, since the column pair do not have similar features, it cannot be recommended by the existing methods.
2.4 Approach and Goal
As an approach to solving Problem 1, we propose a method utilizing low frequent words to filter columns that appear frequently (referred to as “Frequent Column Filtering (FCF)” below).
As an approach to solving Problem 2, we propose a method to recommend unresolved columns based on user matching results (referred to as “Unresolved Column Matching (UCM)” below). In UCM, the user is asked to specify columns that can be reliably matched. Based on the results, unresolved columns are recommended with regard to table pairs that have high table matching scores using low frequent words.
In this report, after proposing the overall concept, our first step is to implement and evaluate our approach to Problem 1. Also, based on the Problem 1 evaluation results, we estimate the effect of our approach to Problem 2.
As mentioned in the section 1, transforming the factory data for our group took 50 days of effort (5 people working for 10 days). To reduce this workload so that one person is required instead of five, our goal is to reduce the data transformation cost by 80%.
3.Proposed method
As discussed in the section 2.3, we propose a column matching method based on low frequent words, which has two steps comprising FCF and UCM. Through data transformation from factory data to CMSD, we found two things below.
- A user firstly determines column pairs which can be reliably matched, and then matches other columns based on first matched column pairs.
- Reliably matched pairs have a word that can be distinguished from words other pairs have.
Considering the above findings, our method firstly finds reliably matched pairs with FCF. After that, UCM identifies other column pairs using reliably matched pairs. Specifically, Figure 2 shows how to select destination columns (columns in factory data) for source columns (columns in CMSD).
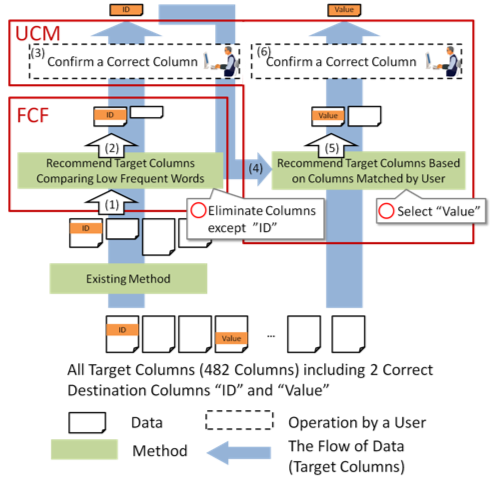
In FCF, (1) column pairs recommended by an existing method are obtained. (2) By comparing low frequent words, the recommendation candidates are narrowed down. The narrowed down candidates are recommended to the user. Details of this method are discussed in sections 3.2 and 3.3.
In UCM, (3) the user is asked at first to confirm that the columns can be reliably matched among a list of column pairs recommended by FCF. (4) On receiving this confirmation information, table matching scores are calculated, and table pairs with high matching scores are selected. A table matching score between source and destination tables can be 0 or 1. It is calculated as 1 if one or more column mappings exist between them. It is calculated as 0 otherwise. (5) Then, for the selected table pairs, each of unresolved destination columns is coupled with an unresolved source column. Finally, (6) the user is asked to match columns recommended by UCM.
3.2 Extraction of Low Frequent Words
In this section, we explain how to extract a low frequent word which is a word whose occurrence frequency in tables is lower than a threshold. A low frequent word is extracted according to the following three steps.
- (1) If a table name or a column name in a table consists of multiple words, split the name into separated words. For example, if a column name and a table name are written in the camel case, they can be split so that each word starts with a capital letter. The camel case is a compound word notation in which all the space characters between words are removed and the first character of each word is shown by an upper-case letter. Other naming methods are available; the snake case using the underscore character "_" and the chain case using the hyphenation character "-". Words chained by space characters " " can make sense as a naming method.
- (2) For each of the words obtained at step (1), count the number of tables each word occurs (referred to as the “table frequency” below).
- (3) A word is recognized as "low frequent" if its table frequency does not exceed a threshold (referred to as the “table frequency threshold” below). The table frequency threshold can be determined as the proportion of table frequency among all the tables in the data.
Specifically, using Figure 3, we explain how to extract low frequent words with the 10% table frequency threshold.
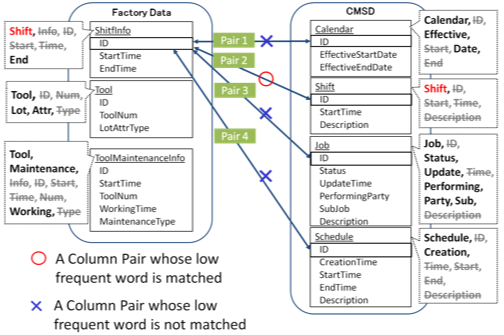
- (1) For the ShiftInfo in the factory data, the table name ShiftInfo and column names ID, StartTime and EndTime are split into words. Specifically, ShiftInfo can be split into Shift and Info, and StartTime can be split into Start and Time respectively.
- (2) The word Start appears twice in the factory data once in the ShiftInfo, and once in the ToolMaintenanceInfo, so the table frequency of the word Start is 2. Similarly, the table frequency of Shift is calculated as 1.
- (3) If the factory data comprises 10 tables, a low frequent word is defined as a word whose table frequency is no more than 10 tables × 10% = 1. In the factory data, the word Start has a table frequency of 2, so it is not a low frequent word. On the other hand, the word Shift has a table frequency of 1, and thus it is selected as a low frequent word.
3.3 Frequent Column Filtering
FCF filters column pairs utilizing low frequent words. Low frequent words are compared between factory data and CMSD. If a low frequent word in the factory data completely matches that in CMSD, a pair of tables having the matched low frequent words is selected. If a table pair includes a column pair recommended by an existing method, the column pair is selected as a recommendation candidate. In Figure3, Pair 2 (ID of ShiftInfo in factory data and ID of Shift in CMSD) is selected as a recommendation candidate because both the columns have the low frequent word Shift. On the other hands, the other column pairs (pair1, pair3 and pair4) are filtered because no low frequent words match between the factory data and CMSD.
4.Evaluation
4.1 Evaluation Method
We evaluated FCF using factory data provided by our group as transformation source data and CMSD as transformation target data. Table 1 shows the details of the used data.
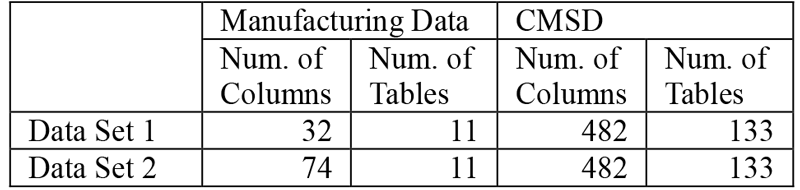
FCF only works on column pairs recommended by an existing method [8]. Data Set 1 does not include column pairs that are not recommended by the existing method. As destination columns of Data Set 1, we used columns provided by the existing method with a condition parameter "the overall matching score is at least 30%" as mentioned in the section 2.1. Data Set 2 includes all the columns. We verified the accuracy of our results in terms of their precision and recall. The precision means the proportion of correct columns among the recommended columns. The recall means the proportion of correct recommended columns among all the correct columns.
As a baseline, we used a column matching method based on column features [8]. The existing method [8] have functionality to build a machine learning model called “base learner” based on the semantic distance to obtain a matching score for column names or table names. Building a model takes long time, as we do not have any previous mapping result and we need to create data for learning manually. So we used a pre-defined model provided NLTK WordNet [13] with the shortest path based measure in this evaluation. WordNet [14] is an English dictionary that classifies words by synonyms, semantic similarities, inclusive relations and so on. A single matching score can be calculated by the following steps:
Step 1: To split a source feature name for the comparison into individual words. The words are represented as ws={ws1,ws2,…,wsn}.
Step 2: Similarly, to split a destination feature name for the comparison into individual words. The words are represented as wd={wd1,wd2,…,wdn}.
Step 3: For each word in ws, to obtain a word in wd having the minimum distance from a destination word in ws, then calculate a word matching score for the minimum distance word pair. The distance between two words and the word matching score can be calculated by utilizing WordNet.
The weight of single matching scores for column names and table names were both set to 0.5. The threshold for the overall matching score varied from 0% to 70% in 10% increments. In the proposed method, the table frequent threshold varied from 10% to 50% in 10% increments.
4.2 Evaluation Results
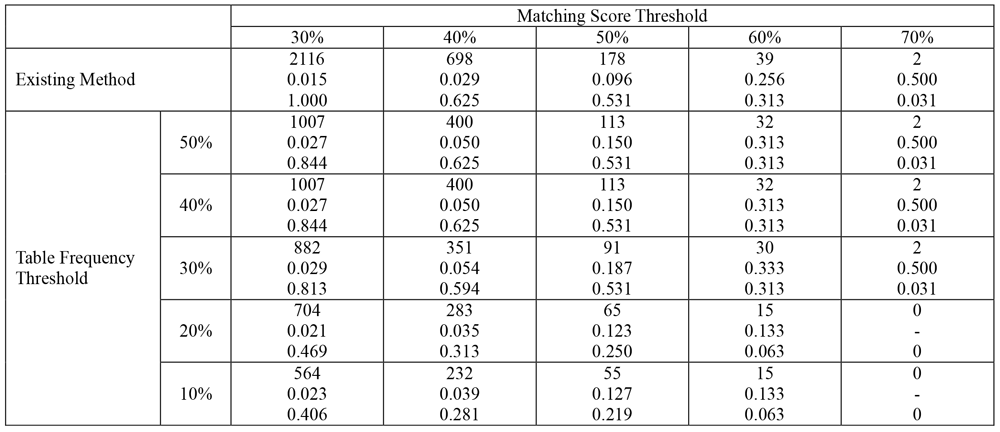
Table 2 shows the result of evaluation using the data set 1. Values in each cell indicates "recommended source/destination column pair number", "precision" and "recall" in order from the top. We confirmed that when the matching score threshold was set to 30% and the table frequent threshold was set to 30%, the recall and the precision were 81% and 2.9% respectively. When the matching score threshold was set to 30%, the precision by the existing method [8] showed 1.5%. Increasing the matching score threshold can contribute to decreasing the number of recommended column pairs. For example, when we have 30% table frequency threshold, the number of recom-mended column pairs varied from 882 (with 30% matching score threshold) to 2 (with 70% matching score threshold). The reduced number of recommended column pairs enables to increase the precision up to 50%.
On the other hand, as a result of evaluation for data set 2, we also confirmed that when the matching score threshold was set to 30% and the table frequent threshold was set to 30%, the recall was 35.1%.
We estimated effect of the proposed method to evaluate the possibility of achieving our target of 80% reduction data transformation cost. We made the following assumptions.
- (1) A user performs matching by applying FCF, the existing method [8], UCM, and then manual matching to factory data in order.
- (2) If a column of the factory data doesn’t match any columns of CMSD recommended by FCF, the user has to match the column of the factory data again by the existing method.
- (3) UCM recommends columns in both the factory data and CMSD that have not yet been matched for table pairs where an exactly matched column pair existed.
- (4) CMSD has a flexible scheme to store a variety of data from factories and therefore it is possible that there exist multiple candidates for a column. Thus, the user needs to investigate each candidate in the destination of mapping one by one when the user tries to map the factory data. Based on this fact, we assume that each column in the factory data is compared with all the columns in CMSD in the calculation of required time for manual mapping.
According to these assumptions, we estimated the number of column comparisons using the data set 1. Both the matching score threshold and the table frequent threshold were set to 30%. As a result, FCF recommended 1,198 column pairs, so the user had to make column comparison 1,198 times. Column matching in the assumption (1) done by the user was able to confirm 26 source columns. Then, for leaving 74-26=48 source columns, the existing method proposed 1,252 column pairs. By the existing method, column matching confirmation was done for further 6 source columns. For leaving 48-6=42 source columns, UCM recommended roughly 42×32=1,344 column pairs and the user was able to match 38 source columns. Finally, the user had to match leaving 42-38=4 source columns by hand. This required 482×4=1,928 comparisons. Thus, the complete column matching process required the user to perform 1,198+1,252+1,344+1,928=5,658 column comparisons.
Compared with manual mapping where 35,668 comparisons are required, we were able to reduce the number of column comparisons by 84%. If the number of column comparisons is assumed to be proportional to data transformation cost, then it would be possible to reduce the cost match the factory data to CMSD from 50 days to 8 days. We will therefore be able to achieve our target of reducing the data transformation cost by 80%.
4.3 Mapping to CMSD
In CSMD, its column naming scheme utilizes a group of words such as "equipment" or "inventory" used in general. On the other hand, data derived from a factory has general words and factory-specific abbreviations such as "MST" or "Assn". Thus, a user need to have domain specific knowledge to recommend correct columns when mapping the factory-specific abbreviations.
4.4 Validity of thresholds
We have done additional experiment to check if the parameter values set as the matching score threshold and the table frequent threshold used for the recall and precision calculation can work with other dataset (Data Set 3). Data Set 3 was derived from PCB(Printed Circuit Board) manufacturing, and included process sequence data and facility name data. We removed column pairs from Data Set 3 which were not recommended by the existing method, so it has just 12 columns totally in 5 tables (it had 113 columns totally in 11 tables before the removal). Evaluation result indicated that the number of recommended column pairs, recall, and precision were 295, 25% and 1.0% respectively when using 30% matching score threshold and 30% table frequent threshold.
The recall percentage decreased to 25% with Data Set 3 while it kept 86% with Data Set 1. A main reason for this is that FCF could not extract a word "Process" as a rare word, then it filtered all the tables which have the word. Further investigation indicated that this was caused because Process-related data appeared over multiple tables while facility or dates-related data appeared in only a table. Through our estimation, we found that the recall percentage can increase up to 75% by table granularity adjustment and integration of multiple table including the word "Process" into a table.
The precision percentage also decreased to 1% with Data Set 3 while it kept 2.9% with Data Set 1. This was because (i) Data Set 3 was a star schema and (ii) FCF cannot filter fact table IDs so it recommended all the fact table IDs. Note that the star schema is one of database structure models and can consist of multiple dimension tables and fact tables. Each dimension table has a different table name such as “Process” or “Equipment”, and each record in a dimension table consists of an ID and values correspoinding to the ID. The fact table has multiple records each consisting of IDs in each dimension table. A solution for this problem is excluding the fact tables from a table set so that FCF is not applied to them. This also enables speed up in the fact table mapping process because a user can conduct fact table mapping by utilizing ID mapping result which FCF generates.
4.5 Applicable scope of proposed method
Factory data we discuss in this paper is raw data generated manually from information on production planning, operator capability, or BOM (Bill of Materials). It is usually modified depending on a specific data model so that users can utilize the data with a production simulator or a manufacturing process visualization tool. Threfore, some users may have their data transformation tools. However, it may be difficult to expand their tools to transform their data depnding on the CSMD model if functionality of the tools is limited or implementation of the tools is quite complicated. Our proposal enables to transform factory data depending on the CSMD model without any transform tools.
5.Conclusion
Asset sharing in manufacturing industry has recently been expected to improve mutual productivity. Column matching between factories is required for asset sharing, but it takes a lot of cost to match the columns of consignors and consignees. To reduce the column matching cost, we proposed a new column matching method to identify columns efficiently by utilizing low frequent words in column names and table names to improve matching precision. As the result of evaluation with actual factory data, our proposal improved the precision by 93% compared with the existing method. Furthermore, according to our estimation of the column comparison cost, we confirmed the proposed method reduced 84% of the total column matching cost.
In the near future, we have a plan to apply UCM with factory data and to evaluate data transformation cost of the propose method (FCF and UCM) with ranked recommendation results. We will also enhance our method by utilizing common term pairs extracted from preciously mapped column pairs. This enables to recommend columns with higher accuracy and to reduce data transformation costs for a factory. We will also develop a method to automatically determine threshold values in FCF, as it takes a lot of cost to determine them manually for each factory.
Reference
- 1)Industrial Internet Consortium, http://www.iiconsortium.org/ (Mar. 2017)
- 2)Industrie 4.0, https://www.plattform-i40.de/I40/Navigation/EN/Home/home.html (Mar. 2017)
- 3)Wu, D., et al. : Cloud-Based Design and Manufacturing : A New Paradigm in Digital Manufacturing and Design Innovation, Computer-Aided Design, Vol.59, pp.1-14 (2015).
- 4)Katsumura, y., et al. : A Study of Manufacturing Effectiveness on Cloud-based Manufacturing System, Transactions of The JSME (in Japanese), Vol.82, pp.15-00430-15-00430 (2016).
- 5)Lee, Y-T. T. : A Journey in Standard Development : The Core Manufacturing Simulation Data (CMSD) Information Model, Journal of Research of The National Institute of Standards and Technology (2015).
- 6)An Approach for ISA-95 Application to Industrial Systems, https://isa-95.com/download/approach-isa-95-application-industrial-systems (Mar. 2017)
- 7)Johnsson, c., et al. : Introducing The ISO 22400 Standard, http://www.control.lth.se/media/Education/EngineeringProgram/FRTN20/2015/ISO%2022400%20White%20Paper.pdf (Mar. 2017)
- 8)AnHai, D., et al. : Reconciling Schemas of Disparate Data Sources : A Machine-Learning Approach, ACM Sigmod Record. Vol.30. No.2. ACM (2001).
- 9)Rodrigues, D., et al. : Using Active Learning Techniques for Improving Data-Base Schema Matching Methods : Neural Networks (IJCNN), pp.1-8 (2015).
- 10)Zhang, C. J., et al. : CrowdMatcher : Crowd-Assisted Schema Matching, ACM SIGMOD, pp.721-724 (2014).
- 11)Hung, N. Q. V., et al. : Pay-as-You-Go Reconciliation in Schema Matching Networks, ICDE, pp.220-231 (2014).
- 12)David, A., et al. : Schema and Ontology Matching with COMA++, ACM SIGMOD, pp.906-908 (2005).
- 13)Installing NLTK Data, https://www.nltk.org/data.html (Oct. 2018)
- 14)Princeton University, About WordNet, Mar. 2015, https://wordnet.princeton.edu/ (Mar. 2017)
Takuya Komatsuda received B.S. and M.S. degrees from the Department of Computer Science, Tokyo Institute of Technology in 2014, and 2016, respectively. He joined the Hitachi, Ltd., Tokyo, Japan in 2016, where he was engaged in the research of column matching for manufacturing industry. His current research interests include data analysis.
Toshihiko Kashiyama (Regular Member)toshi-hiko.kashiyama.ez@hitachi.comToshihiko Kashiyama received B.S. and M.S. degrees from the Department of Computer Science, Tokyo Institute of Technology in 2003, and 2005, respectively. He joined the Central Research Laboratory, Hitachi, Ltd., Tokyo, Japan in 2005, where he was engaged in the research of database systems especially in real-time data stream processing system. He received Funai best paper award in 2004. His current research interests include data processing platform technologies for agile data preparation.
Hiroaki Shikano(Regular Member)hiroaki.shikano.gm@hitachi.comHiroaki Shikano received B.S. and M.S. degrees from the Department of Information and Systems Engineering, Chuo University and a Ph.D. degree from the department of Computer Science, Waseda University, Tokyo, Japan in 2000, 2002, and 2009, respectively. He joined the Central Research Laboratory, Hitachi, Ltd., Tokyo, Japan in 2002, where he was engaged in the research of embedded processor systems, network systems and their solutions, operational management of datacenters. He received IPSJ Yamashita SIG award in 2007. His current research interests include data processing platform technologies for agile data preparation.
Accepted:November 28, 2018
Editor:Kunihiko Sadaoka(The University of Tokyo)